감성분석을 활용한 언론사의 양극화 분석
주제 선정 배경
-
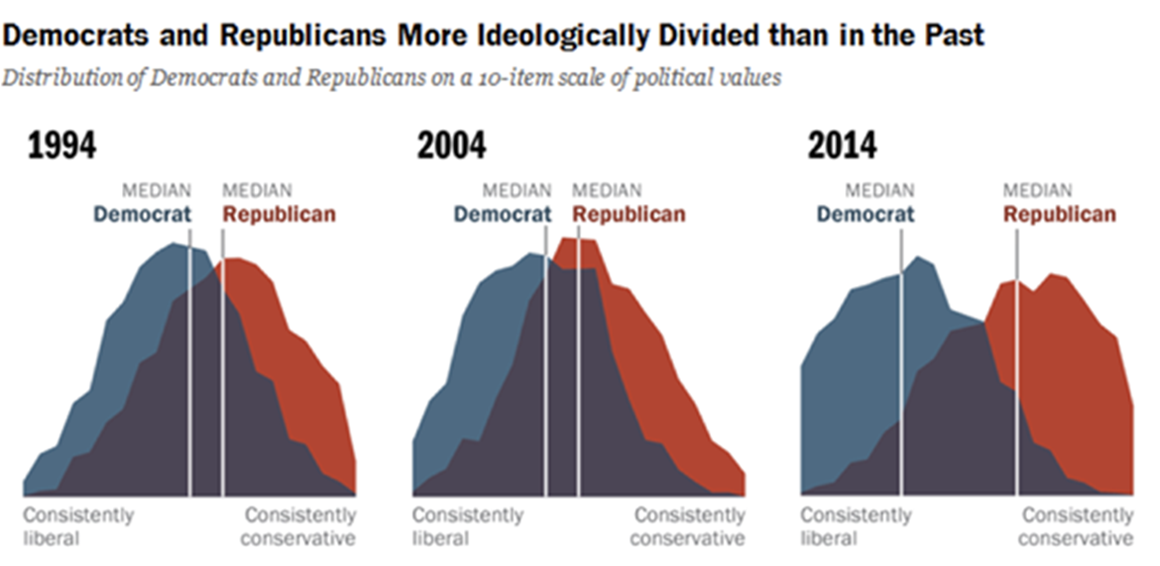
언론은 민주주의 사회에서 중요한 역할을 수행해야 하지만 정치적 양극화가 심화됨에 따라 언론의 공정성과 객관성에 대한 신뢰가 저하되고 있다.
특정 정치적 견해를 지지하거나 반대하는 보도가 늘어나면서 독자들은 자신이 선호하는 정보만을 소비하게 되고 이는 사회적 갈등을 심화시키는 결과를 낳고 있다. -
인터넷과 소셜 미디어의 발달로 인해 다양한 매체가 생겨나고 이로 인해 개인들은 자신의 정치적 성향에 맞는 정보만을 선택적으로 소비하는 경향이 늘어나고 있다. 이러한 선택적 정보 소비는 각기 다른 사회적 집단 간의 이해와 소통을 저해하고 결국 사회적 분열을 초래하게 될 수 있다.
-
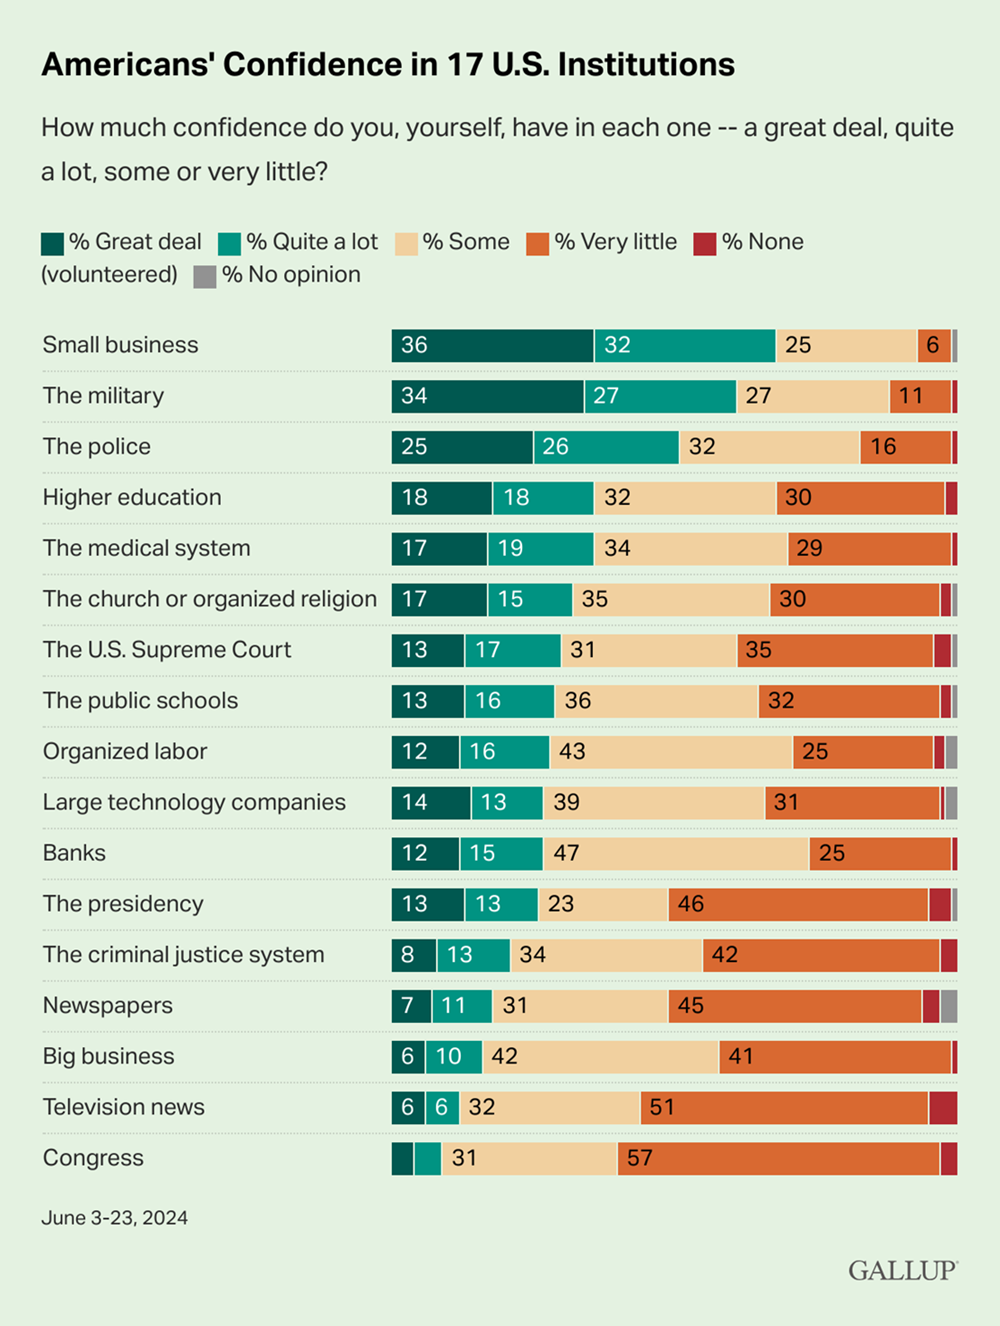
현재 미국인들에게 언론의 신뢰도는 극히 낮다. Gallup과 Knight Foundation의 조사 결과를 보면 약 62% 의 사람들이 TV뉴스, 신문, 라디오가 편향적이라고 생각하고 약 44%의 사람들이 TV뉴스, 신문, 라디오가 부정확하다고 생각한다.
-
따라서 우리는 미국 대선기간 동안 언론사들의 Headline에 대한 Sentiment를 분석하여 각 Topic별 언론사의 객관적인 수치로 언론사의 양극화를 분석해보고자 한다.
언론사 선정
-
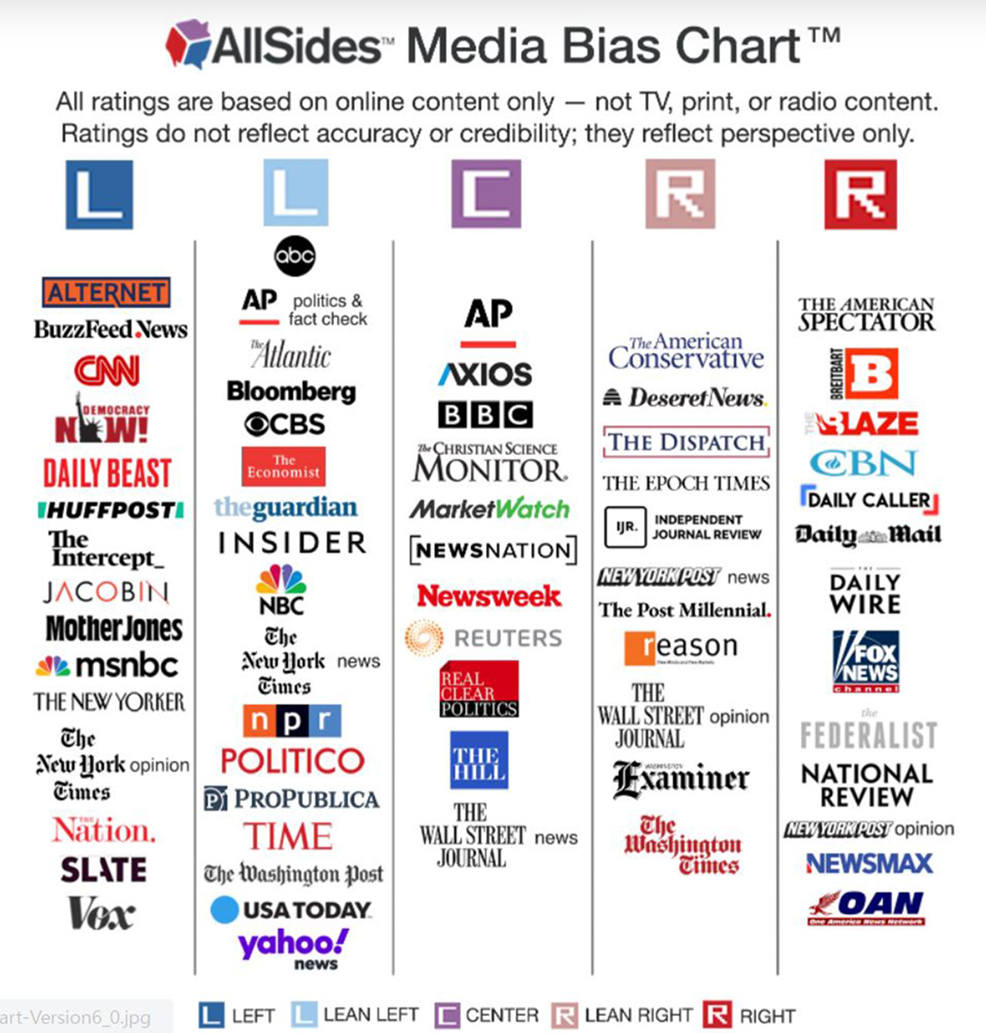
기존의 알려진 미국 언론사의 정치성향을 바탕으로, 진보, 보수, 중도 언론사를 나누어 데이터를 수집하였다.
-
진보성향의 언론사: CNN, New York Times, ABC News
-
중도성향 언론사: BBC와 BLOOMBERG
-
보수성향 언론사: THE WALL STREET JOURNAL, FOX NEWS, New York POST
-
총 8가지의 언론사별 뉴스 토픽을 추출해 감성분석 진행하였다.
-
해당 프로젝트는 미대선 기간 중 이루어졌으며 Trump와 Biden & Harris가 언론의 양극화를 잘 표현한다고 생각하여 각 언론별 Headline을 추출하였다.
데이터셋
-
2024년 06월 부터 2024년 11월 미 대선이 종료될 때까지의 각 언론사별 Headline을 추출하였다.
-
데이터 수집은 ‘Trump’, ‘Biden’ 혹은 ‘Harris’가 포함된 Headline을 수집하였다.
-
대부분의 언론사들이 크롤링을 막아놓아서 손으로 가져왔다. 총 데이터 구조는 아래와 같으며
df로 저장하였다.Organ Title 0 CNN Kamala Harris Keeps Snubbing President Biden s… 1 CNN Jill Biden Closes Out Campaign with Her Own Pu… 2 CNN Biden Returns to His Hometown After a Limited … 3 CNN Harris Addresses Economic Concerns During Inte… 4 CNN Former Obama Speechwriter Says Biden s Garbage… … … … 2950 New York Post Donald Trump tells regular golf buddies he l… 2951 New York Post California teacher suspended after foul mouthe… 2952 New York Post Trump won by uniting those who think liberal r… 2953 New York Post Trump s new border czar vows that sanctuary ci… 2954 New York Post FEMA outrage reveals weaponized government and… -
가장 먼저 중복을 제거해주고 정규식을 이용하여 숫자와 영어, 한글을 제외한 모든 글자는 제거하였다.
df_filter = df.drop_duplicates(['title', 'Organ'], keep = 'first') df_filter.title = df.title.apply(lambda x : re.sub('[^A-Za-z0-9가-힣]',' ', x)) df_filter.title = df_filter.title.apply(lambda x : re.sub(' +',' ', x)) -
해당 작업을 마치고
sdf에 저장하였다.sdf는 아래와 같다.Organ Title 0 CNN Kamala Harris Keeps Snubbing President Biden s… 1 CNN Jill Biden Closes Out Campaign with Her Own Pu… 2 CNN Biden Returns to His Hometown After a Limited … 3 CNN Harris Addresses Economic Concerns During Inte… 4 CNN Former Obama Speechwriter Says Biden s Garbage… … … … 2654 New York Post Donald Trump tells regular golf buddies he l… 2655 New York Post California teacher suspended after foul mouthe… 2656 New York Post Trump won by uniting those who think liberal r… 2657 New York Post Trump s new border czar vows that sanctuary ci… 2658 New York Post FEMA outrage reveals weaponized government and…
RoBERTa 감성분석
-
RoBERTa(robustly optimized BERT approach)는 BERT 모델을 기반으로 한 자연어 처리(NLP) 모델로 더 큰 데이터셋과 향상된 훈련 기법을 통해 성능을 극대화한 모델이다.
-
BERT와 달리 RoBERTa는 동적 마스킹을 활용하여 문맥의 다양성을 높였으며 더 긴 훈련시간과 배치 크기를 통해 학습한다. 이로 인해 RoBERTa는 감성 분석, 질문 응답, 문서 분류 등 다양한 NLP 작업에서 뛰어난 성능을 발휘하며 특히 뉴스 기사의 감성 분석을 통해 언론사의 정치적 성향을 판별하는데 효과적이다.
-
전처리를 통해 혹시 남아있을 멘션이나 URL을 일반화 하였고 MODEL은 트위터 텍스트의 감성을 예측하도록 학습된 모델을 사용했다.
cardiffnlp/twitter-roberta-base-sentiment-latest -
RoBERTa의 감성분석은 아래와 같이 진행되었다.
def preprocess(text): new_text = [] for t in text.split(" "): t = '@user' if t.startswith('@') and len(t) > 1 else t t = 'http' if t.startswith('http') else t new_text.append(t) return " ".join(new_text) MODEL = f"cardiffnlp/twitter-roberta-base-sentiment-latest" tokenizer = AutoTokenizer.from_pretrained(MODEL) config = AutoConfig.from_pretrained(MODEL) # PT model = AutoModelForSequenceClassification.from_pretrained(MODEL) text = "Covid cases are increasing fast!" text = preprocess(text) encoded_input = tokenizer(text, return_tensors='pt') output = model(**encoded_input) scores = output[0][0].detach().numpy() scores = softmax(scores) ranking = np.argsort(scores) ranking = ranking[::-1] for i in range(scores.shape[0]): l = config.id2label[ranking[i]] s = scores[ranking[i]] print(f"{i+1}) {l} {np.round(float(s), 4)}") -
‘Headline’에 대해 감성분석을 진행하였고 각 부정, 중립, 긍정의 점수를 데이터 프레임에 추가하였다.
  for index, row in sdf.iterrows():
  text = row['title']
  if isinstance(text, str):
      preprocessed_text = preprocess(text)
      encoded_input = tokenizer(preprocessed_text, return_tensors='pt')
      output = model(**encoded_input)
      scores = output[0][0].detach().numpy()
      scores = softmax(scores)

      sdf.at[index, 'R_negative'] = scores[0]
      sdf.at[index, 'R_neutral'] = scores[1]
      sdf.at[index, 'R_positive'] = scores[2]
  else:
      sdf.at[index, 'R_negative'] = np.nan
      sdf.at[index, 'R_neutral'] = np.nan
      sdf.at[index, 'R_positive'] = np.nan
Index Organ Title R_negative R_neutral R_positive 0 CNN Kamala Harris Keeps Snubbing President Biden s… 0.332771 0.643004 0.024225 1 CNN Jill Biden Closes Out Campaign with Her Own Pu… 0.048842 0.905719 0.045439 2 CNN Biden Returns to His Hometown After a Limited … 0.006408 0.833386 0.160206 3 CNN Harris Addresses Economic Concerns During Inte… 0.116649 0.858796 0.024556 4 CNN Former Obama Speechwriter Says Biden s Garbage… 0.752685 0.232915 0.014400 … … … … … … 2654 New York Post Donald Trump tells regular golf buddies he l… 0.279197 0.677742 0.043061 2655 New York Post California teacher suspended after foul mouthe… 0.881195 0.113187 0.005618 2656 New York Post Trump won by uniting those who think liberal r… 0.078237 0.488182 0.433581 2657 New York Post Trump s new border czar vows that sanctuary ci… 0.540857 0.421274 0.037869 2658 New York Post FEMA outrage reveals weaponized government and… 0.732463 0.253884 0.013653 -
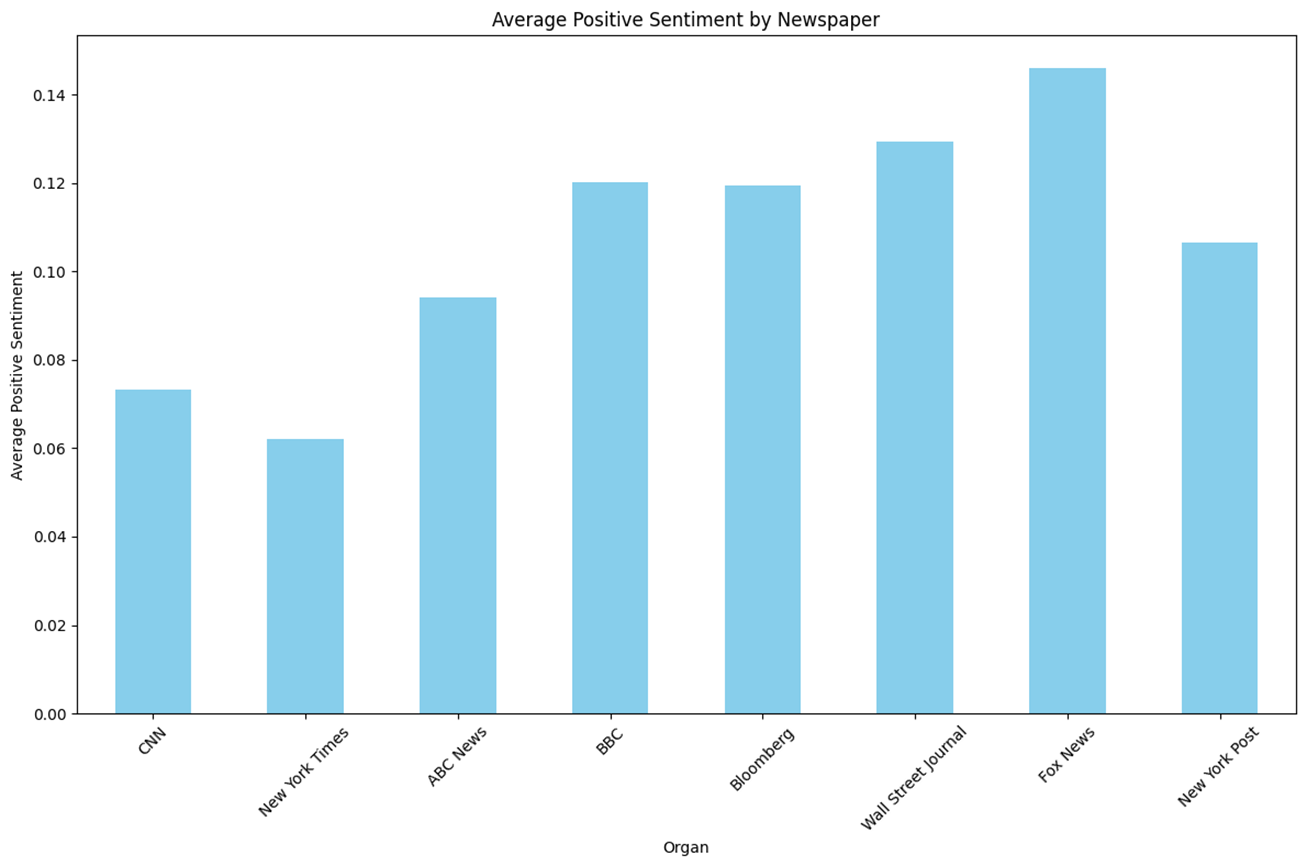
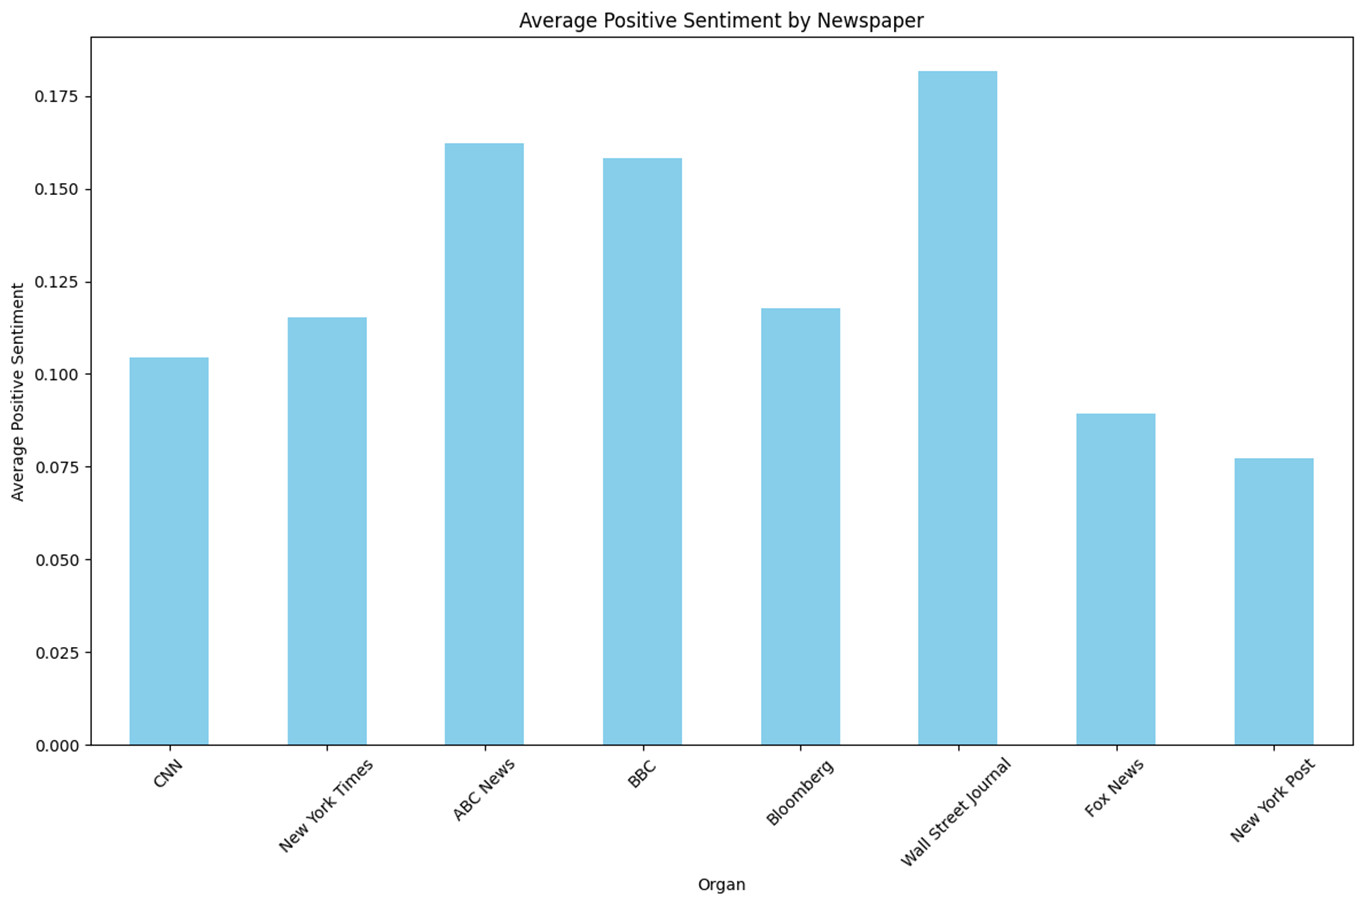
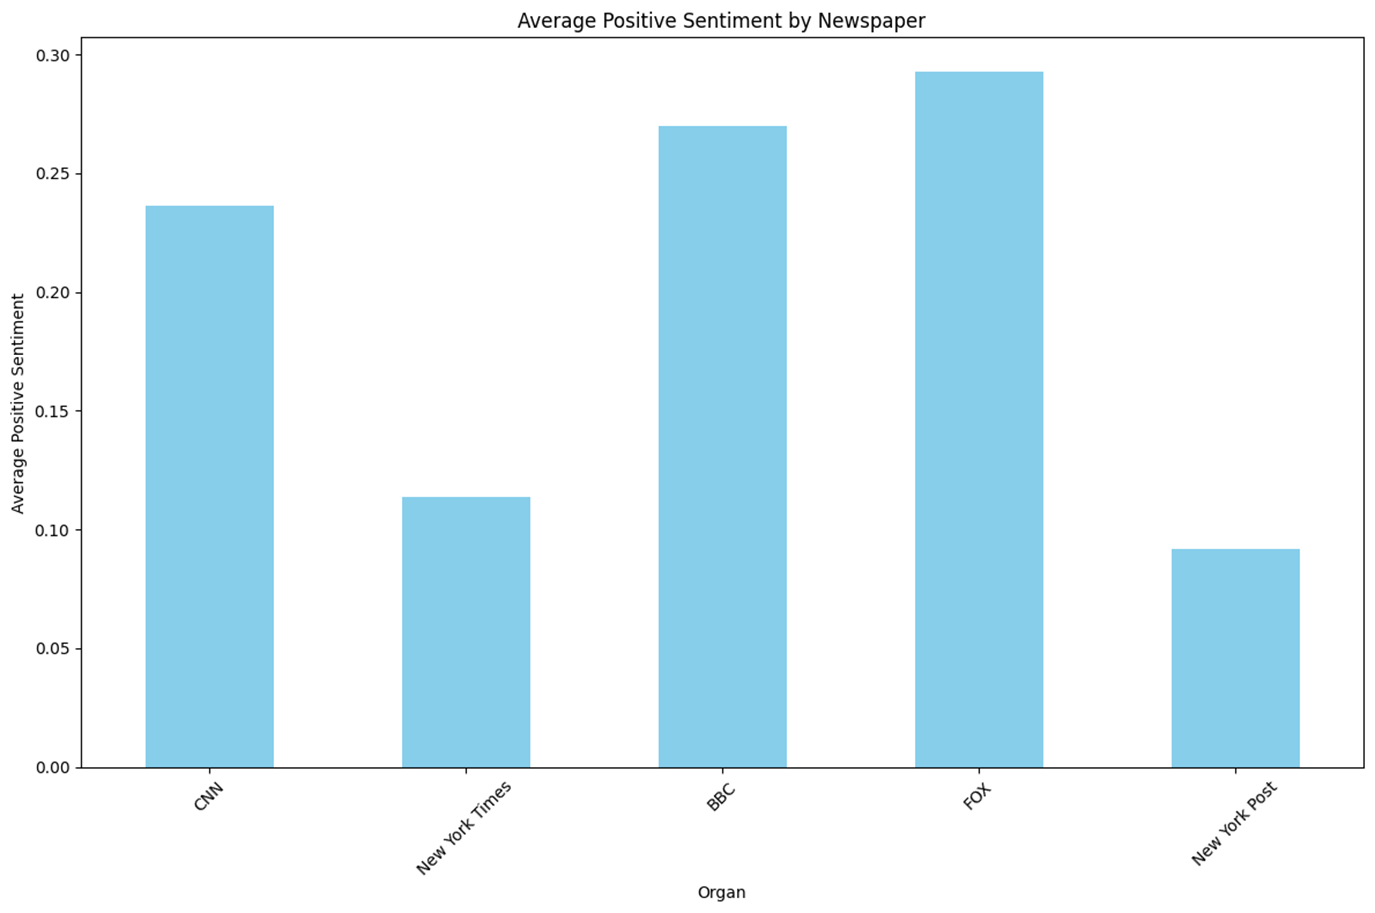
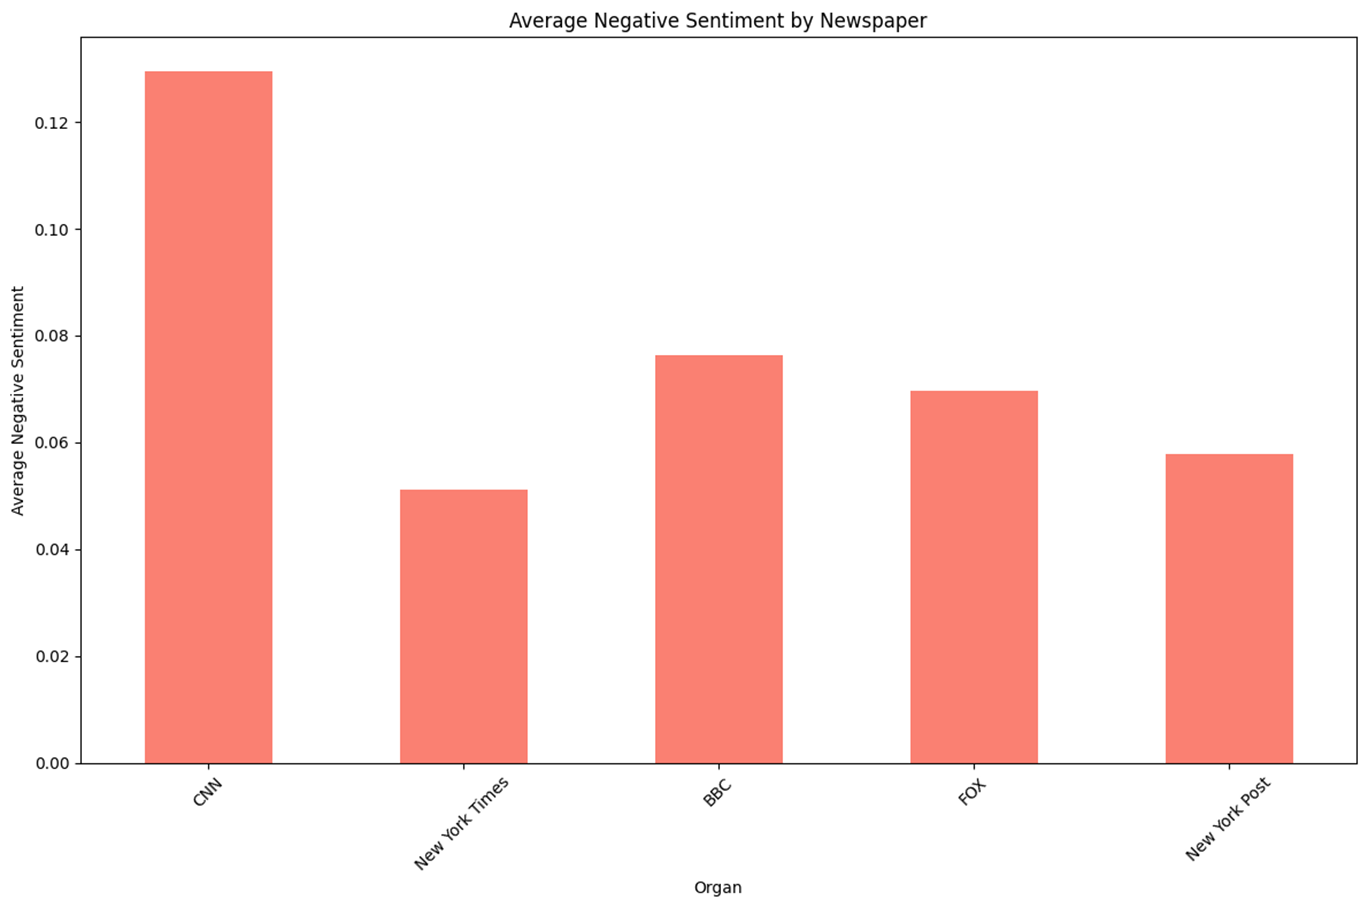
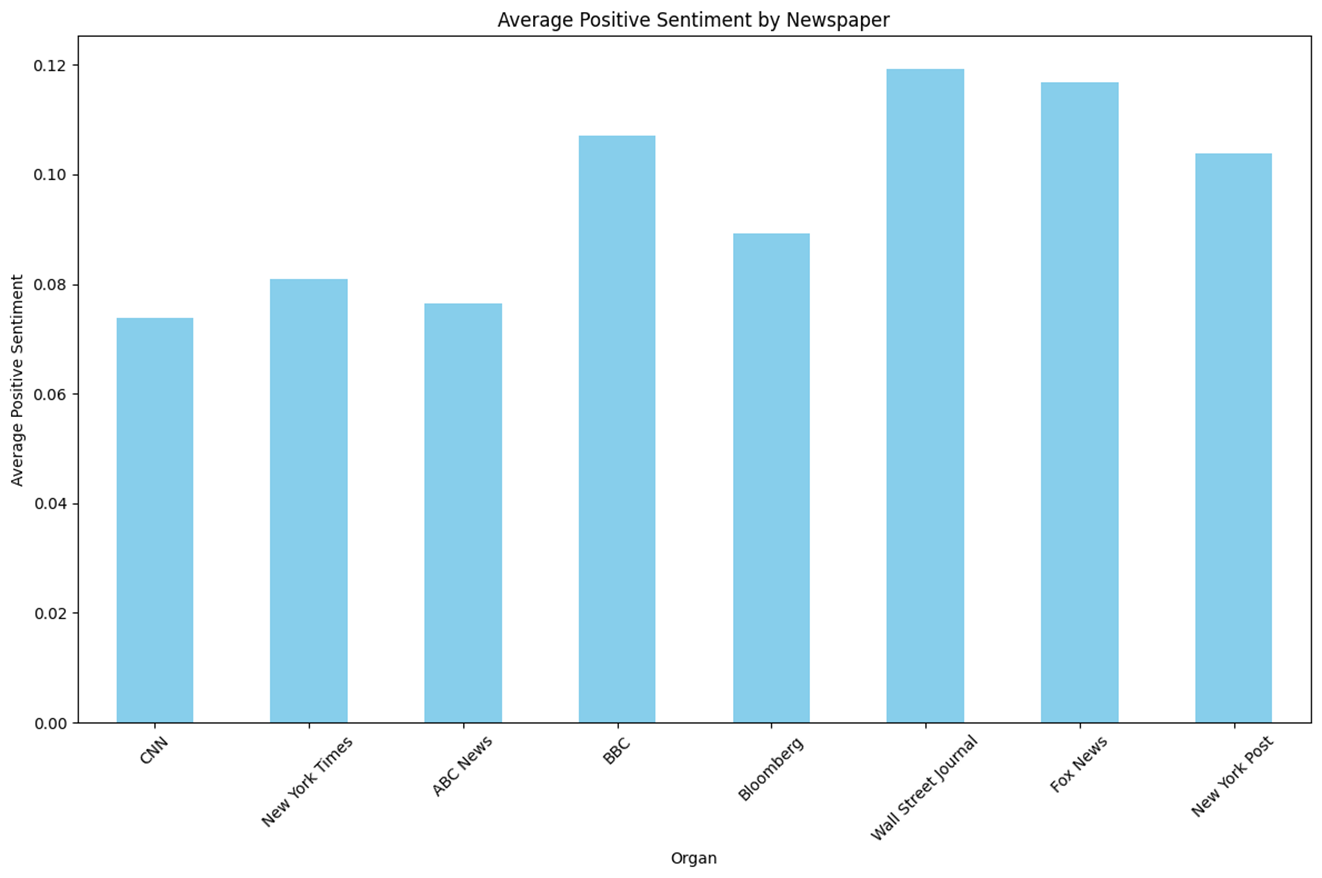
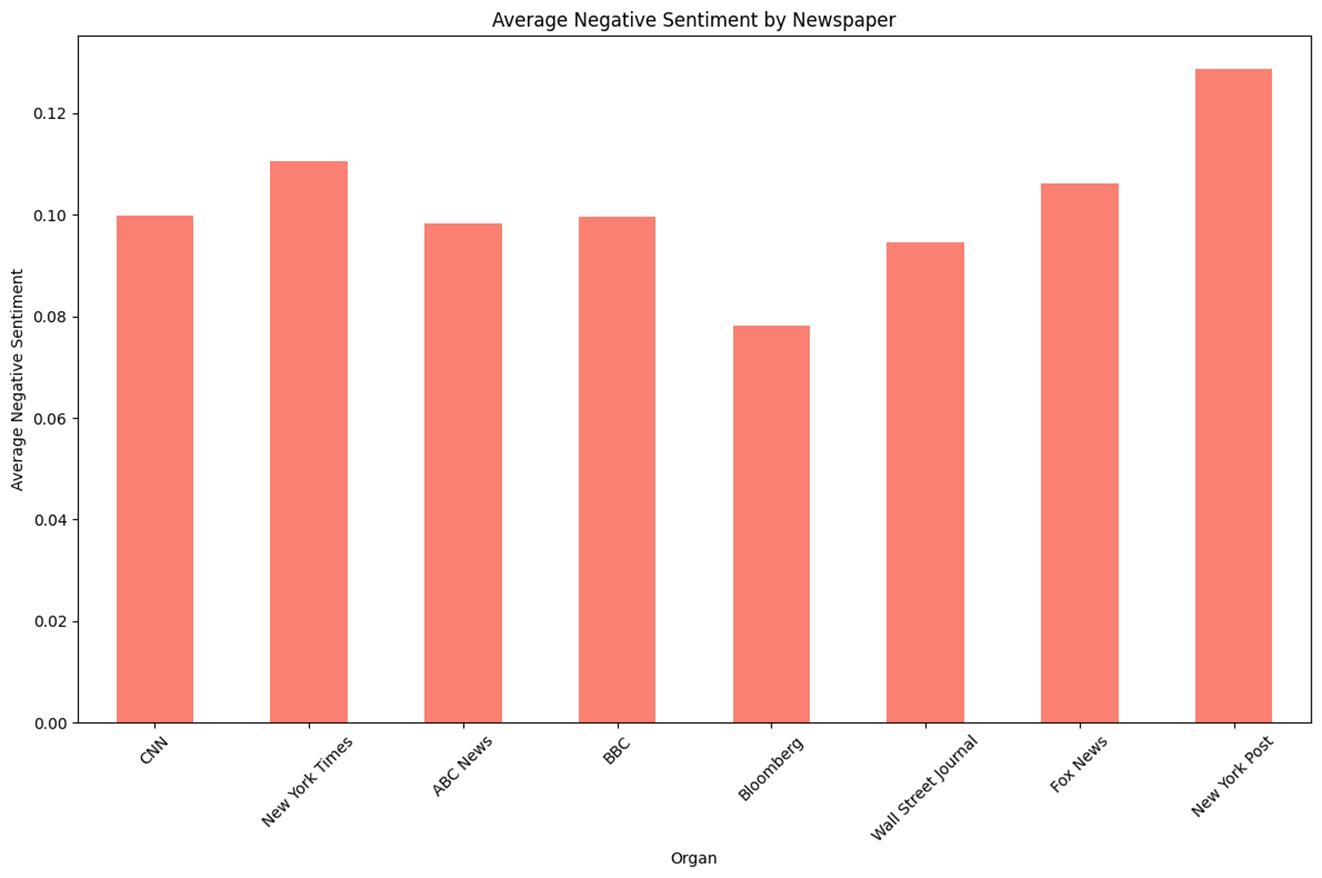
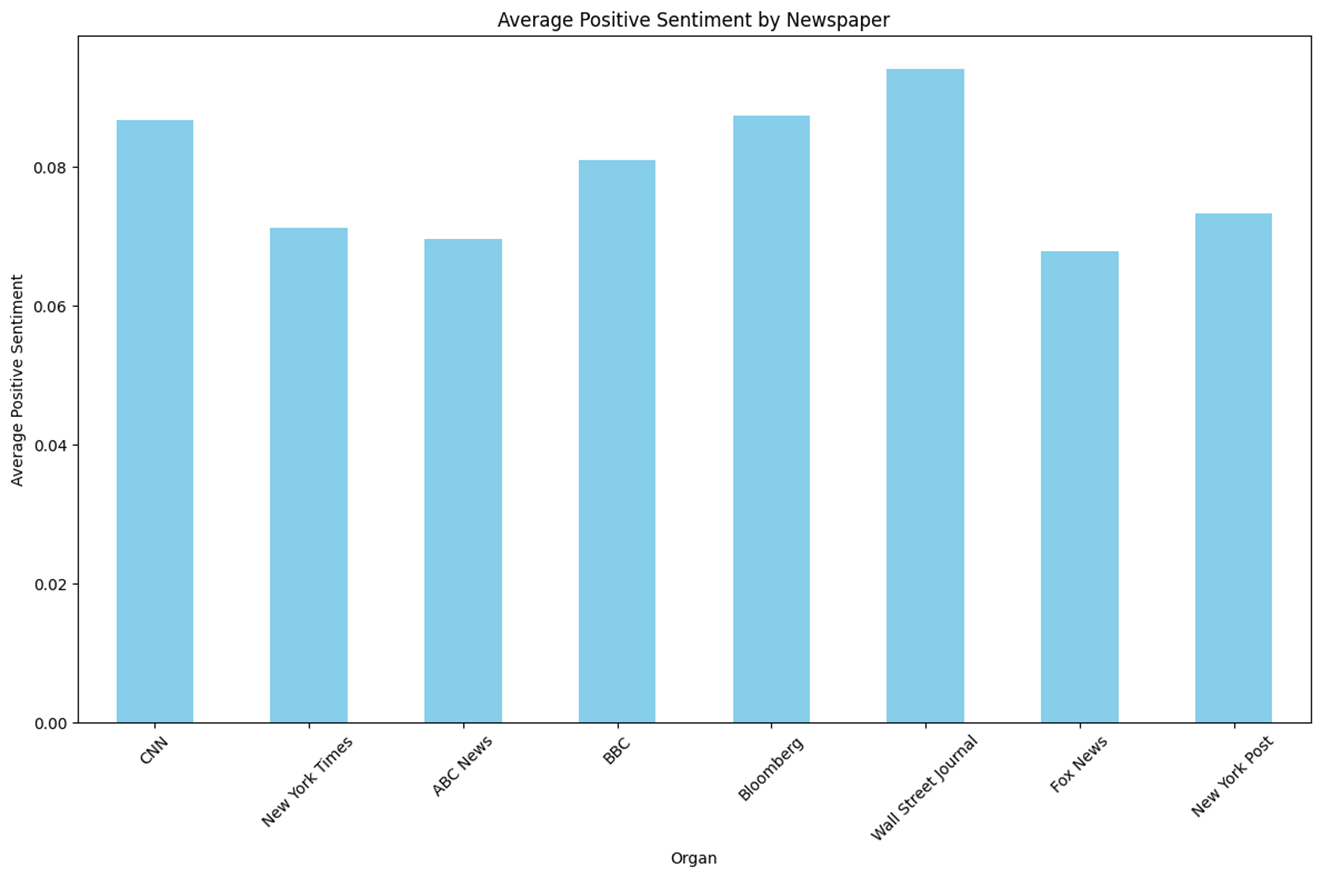
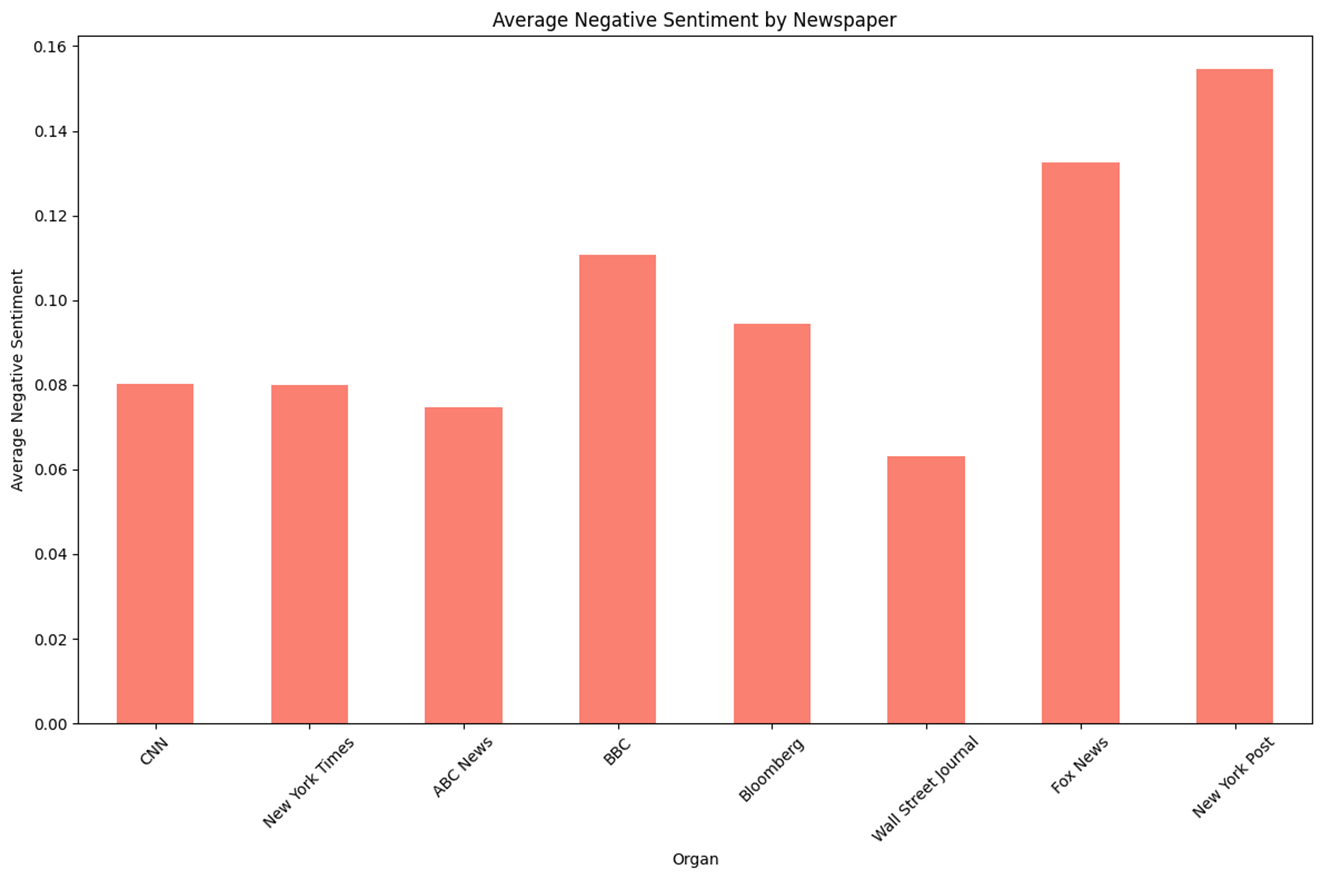
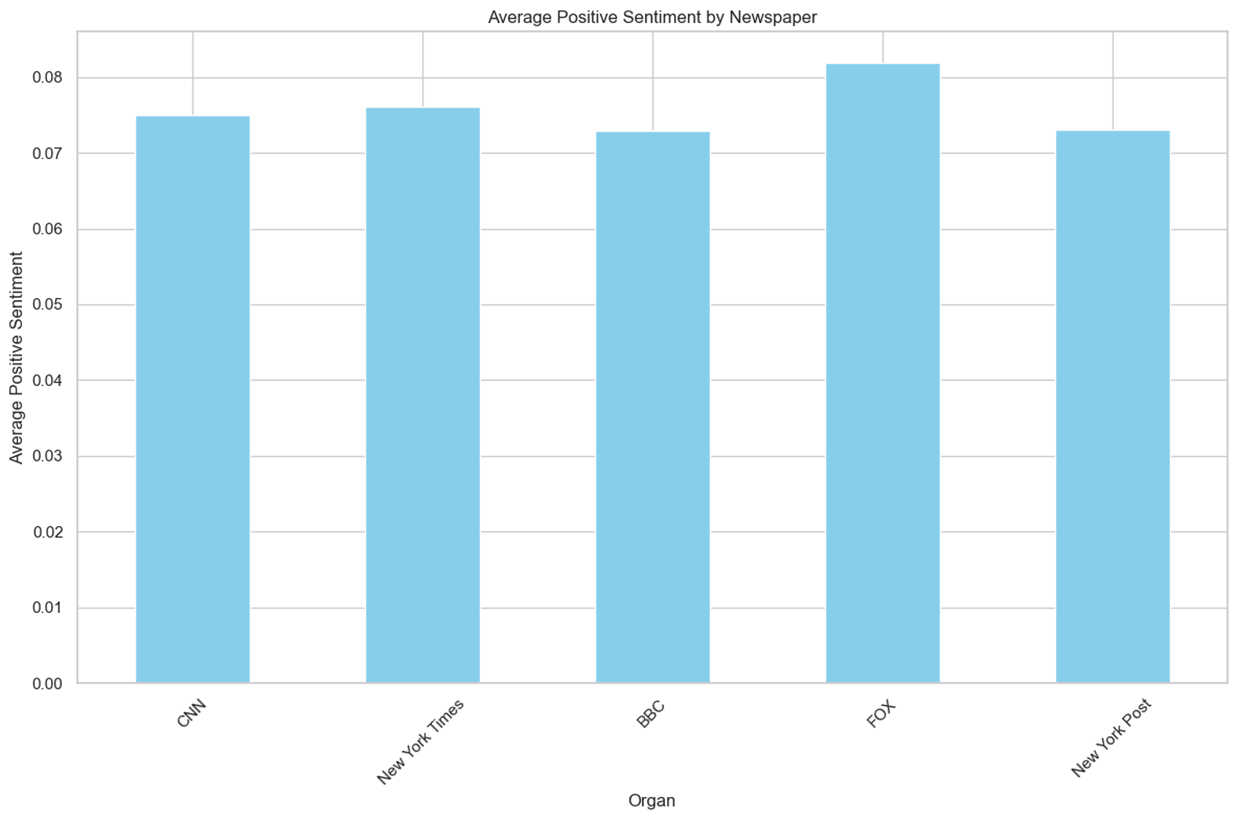
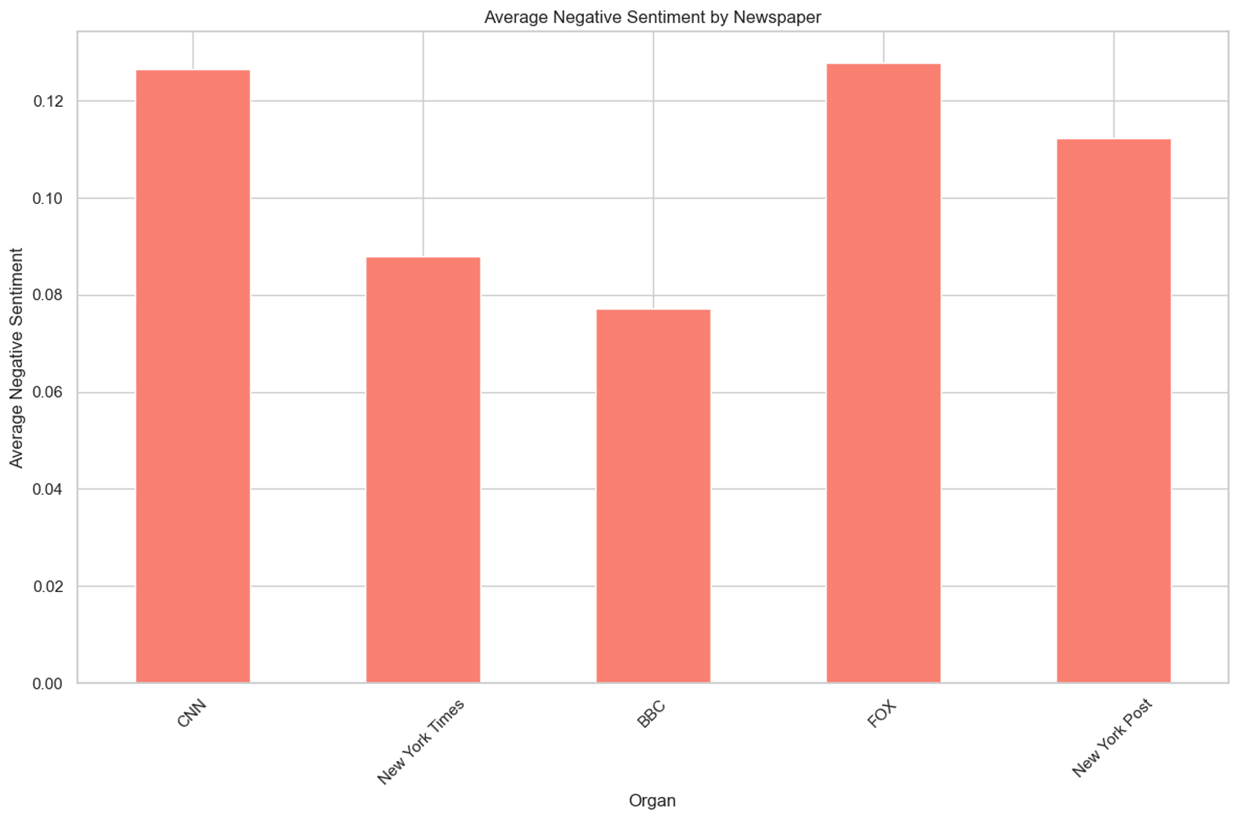
언론사 별로 긍정, 부정 점수를 시각화하였다.
  ordered_newspapers = [
      'CNN', 'New York Times', 'ABC News','BBC', 'Bloomberg', 'Wall Street Journal',
      'Fox News', 'New York Post'
  ]

  average_negative = sdf.groupby('Organ')['R_negative'].mean()
  average_negative = average_negative.reindex(ordered_newspapers)

  average_neutral = sdf.groupby('Organ')['R_neutral'].mean()
  average_neutral = average_neutral.reindex(ordered_newspapers)

  average_positive = sdf.groupby('Organ')['R_positive'].mean()
  average_positive = average_positive.reindex(ordered_newspapers)

  average_negative.plot(kind='bar', figsize=(12, 8), color='salmon')
  plt.title('Average Negative Sentiment by Newspaper')
  plt.xlabel('Organ')
  plt.ylabel('Average Negative Sentiment')
  plt.xticks(rotation=45)
  plt.tight_layout()
  plt.show()

  average_neutral.plot(kind='bar', figsize=(12, 8), color='lightgray')
  plt.title('Average Neutral Sentiment by Newspaper')
  plt.xlabel('Organ')
  plt.ylabel('Average Neutral Sentiment')
  plt.xticks(rotation=45)
  plt.tight_layout()
  plt.show()

  average_positive.plot(kind='bar', figsize=(12, 8), color='skyblue')
  plt.title('Average Positive Sentiment by Newspaper')
  plt.xlabel('Organ')
  plt.ylabel('Average Positive Sentiment')
  plt.xticks(rotation=45)
  plt.tight_layout()
  plt.show()
RoBERTa 감성분석 결과
-
n = 1,734 keyword = ‘Trump’
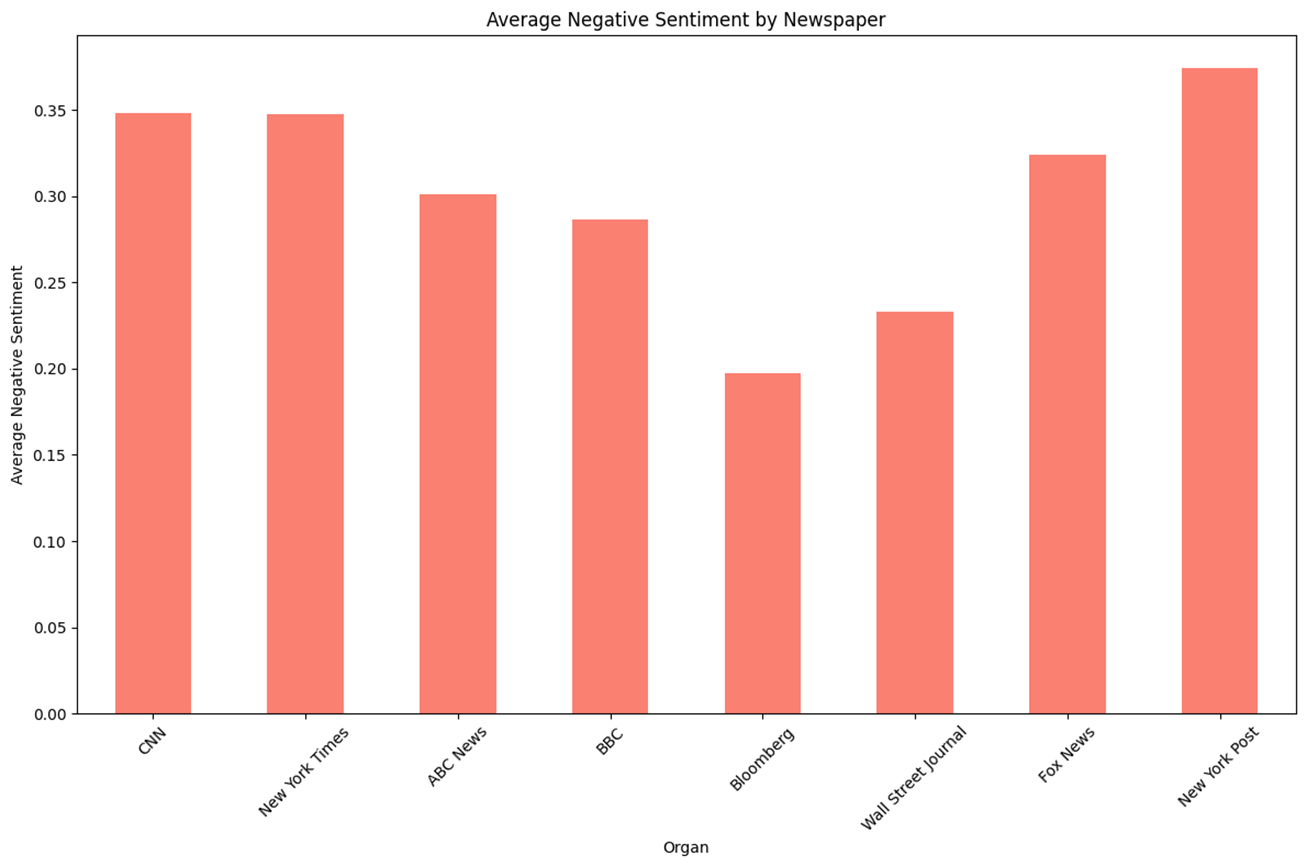
- 기존 보수성향이라고 알려진 언론사일수록 ‘Trump’관련 Topic에 대한 Positive 점수가 높다.
- Negative의 경우 중도성향에 가까울수록 낮아 U자 형태를 보인다.
-
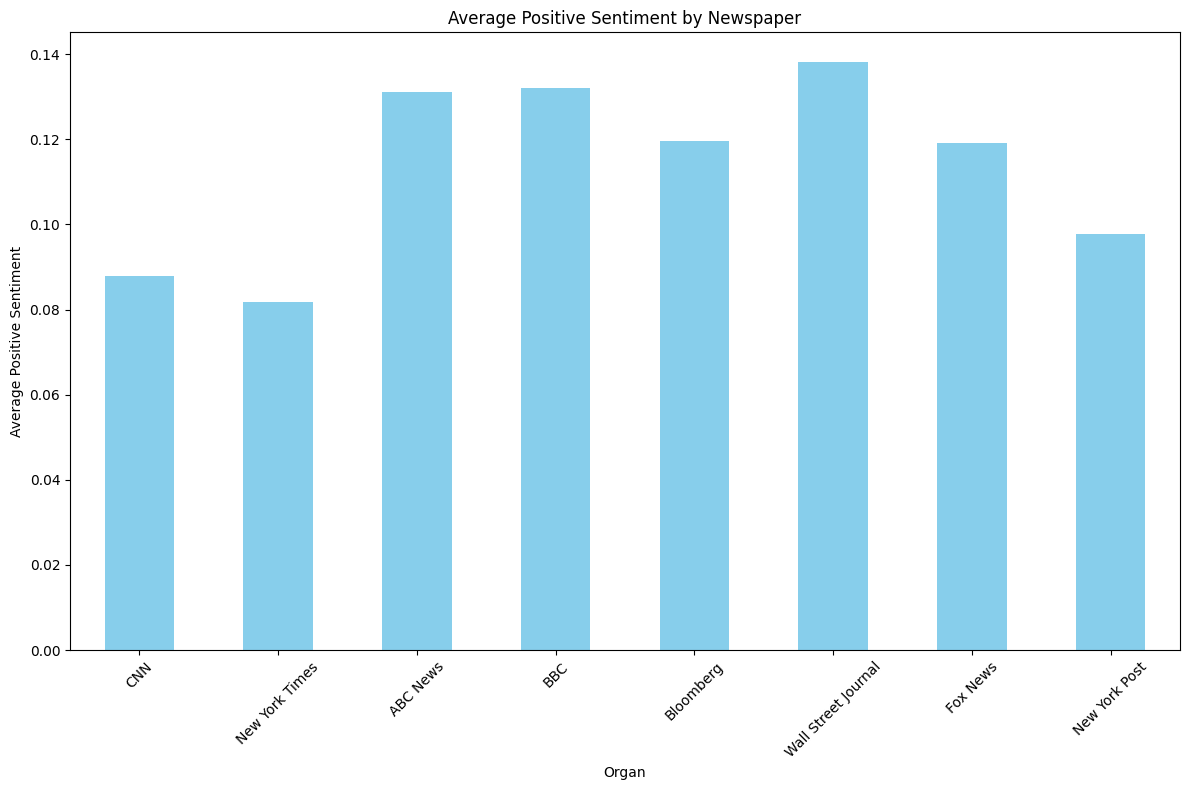
n = 968 keyword = ‘Biden or Harris’
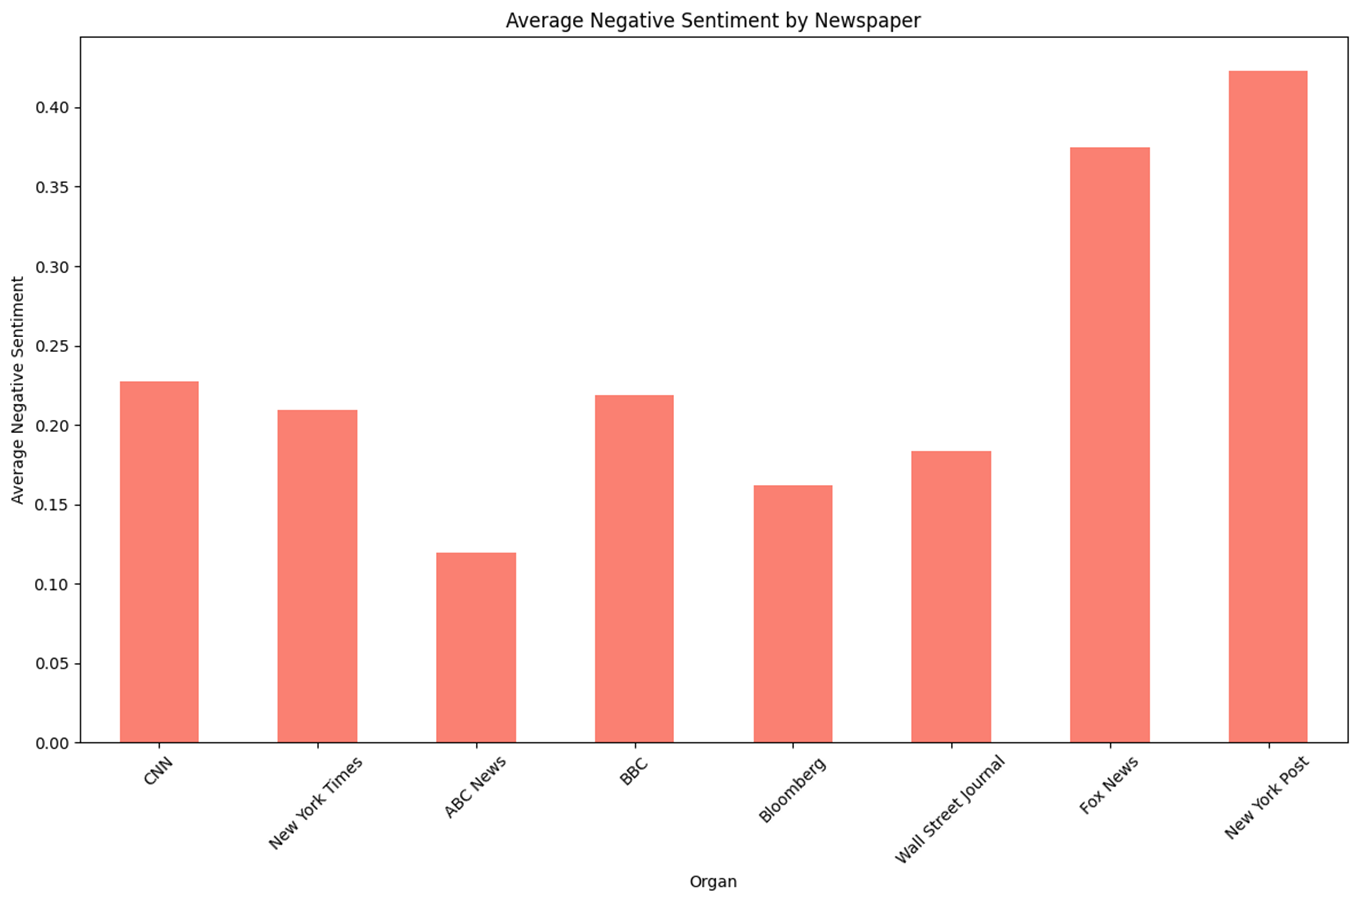
- 기존 진보성향이라고 알려진 언론사들이 보수성향이라고 알려진 언론사에 비해 ‘Biden or Harris’에 관한 Positive 점수가 높은 성향을 보인다.
- Negative의 경우 중도성향에 가까울수록 낮아 U자 형태를 보이며 보수성향의 Negative 점수가 다른 언론사들에 비해 극단적으로 높은 것을 확인할 수 있다.
-
n = 2,659 keyword = ‘Trump’, ‘Biden or Harris’
- 두 키워드를 합쳐보면 전반적으로 Positive 점수는 평탄화되었다.
- Negative 점수는 U자 형태를 보이는 것을 알 수 있다.
-
n = 1,920,976 keyword = Random Sample(2007 ~ 2022) 데이터셋 참조
- 일반적으로 크롤링한 데이터들에 대해 언론사의 점수를 확인하기 위해 추가적으로 조사하였다.
- 진보성향의 New York Times와 보수성향의 New York Post는 타 언론사 대비 일반적인 Headline에서 Positive 점수가 낮았으며 진보성향의 CNN은 타 언론사 대비 일반적인 Headline에서 Negative 점수가 높게 나왔다.
VADER 감성분석
-
VADER(Valence Aware Dictionary and sEntiment Reasoner)는 소셜 미디어와 같은 비공식적인 텍스트에 적합한 감성 분석 도구로, 감정 단어의 사전을 기반으로 한다.
-
문맥적 요소를 고려하여 감정 점수를 조정하며, 빠른 처리 속도로 대량의 텍스트를 분석할 수 있다.
-
VADER의 감성분석은 아래와 같이 진행되었다.
  nltk.download('vader_lexicon')
  sia = SentimentIntensityAnalyzer()
score = [sia.polarity_scores(i) for i in sdf['title']] temp_df = pd.DataFrame(score) sdf = pd.concat([sdf, temp_df[['compound', 'pos', 'neu', 'neg']]], axis=1) sdfIndex Organ Title compound pos neu neg 0 CNN Kamala Harris Keeps Snubbing President Biden s… -0.2263 0.000 0.853 0.147 1 CNN Jill Biden Closes Out Campaign with Her Own Pu… 0.0000 0.000 1.000 0.000 2 CNN Biden Returns to His Hometown After a Limited … -0.2263 0.000 0.808 0.192 3 CNN Harris Addresses Economic Concerns During Inte… 0.0000 0.000 1.000 0.000 4 CNN Former Obama Speechwriter Says Biden s Garbage… 0.4215 0.219 0.781 0.000 … … … … … … … 2654 New York Post Donald Trump tells regular golf buddies he l… 0.0000 0.000 1.000 0.000 2655 New York Post California teacher suspended after foul mouthe… -0.6705 0.000 0.732 0.268 2656 New York Post Trump won by uniting those who think liberal r… 0.5719 0.236 0.764 0.000 2657 New York Post Trump s new border czar vows that sanctuary ci… -0.4238 0.084 0.753 0.164 2658 New York Post FEMA outrage reveals weaponized government and… -0.5106 0.000 0.732 0.268 -
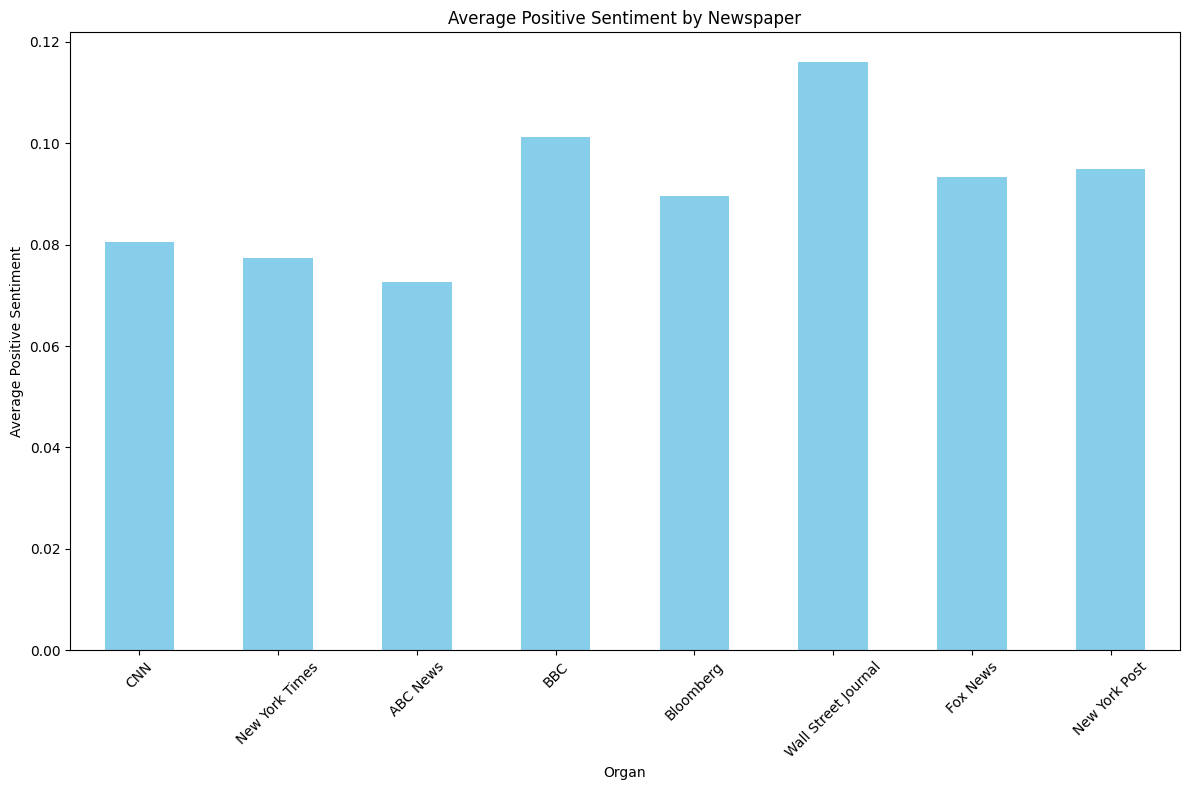
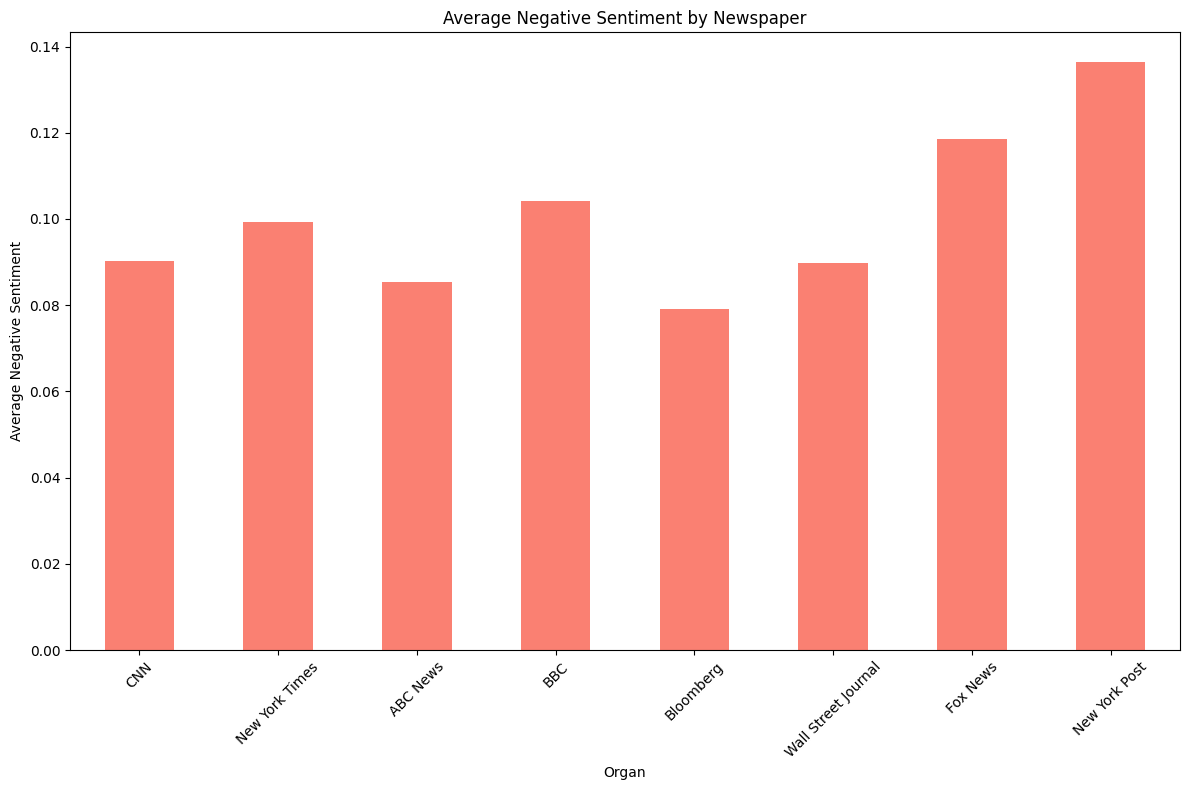
언론사별로 시각화하기 위해 RoBERTa와 같이 평균으로 계산하였다.
  vader_stats = sdf.groupby('Organ', sort=False).agg(
      positive_ratio=('pos', 'mean'),
      negative_ratio=('neg', 'mean'),
      neutral_ratio=('neu', 'mean')
  )
  vader_stats
Organ positive_ratio negative_ratio neutral_ratio CNN 0.080473 0.090269 0.829245 New York Times 0.077367 0.099208 0.823419 ABC News 0.072721 0.085480 0.841802 BBC 0.101216 0.104153 0.794637 Bloomberg 0.089535 0.079175 0.831297 Wall Street Journal 0.116090 0.089897 0.793996 Fox News 0.093438 0.118588 0.787955 New York Post 0.094848 0.136471 0.768692 -
시각화 내용은 아래와 같다.
  vader_stats['negative_ratio'].plot(kind='bar', figsize=(12, 8), color='salmon')
  plt.title('Average Negative Sentiment by Newspaper')
  plt.xlabel('Organ')
  plt.ylabel('Average Negative Sentiment')
  plt.xticks(rotation=45)
  plt.tight_layout()
  plt.show()

  vader_stats['positive_ratio'].plot(kind='bar', figsize=(12, 8), color='skyblue')
  plt.title('Average Positive Sentiment by Newspaper')
  plt.xlabel('Organ')
  plt.ylabel('Average Positive Sentiment')
  plt.xticks(rotation=45)
  plt.tight_layout()
  plt.show()
VADER 감성분석 결과
-
n = 1,734 keyword = ‘Trump’
- 보수성향이라고 알려진 언론사일수록 ‘Trump’관련 Topic에 대한 Positive 점수가 높았다.
- Negative 점수의 경우 중도성향일수록 낮아 U자형태를 보인다.
- RoBERTa와 전반적으로 비슷한 양상인 것을 확인할 수 있다.
-
n = 968 keyword = ‘Biden or Harris’
- 대체적으로 Postive 점수는 일정한 것을 보여주고 있으며 진보성향과 중도성향이 보수성향에 비해 조금 높은 것을 알 수 있다.
- Negative 점수의 경우 RoBERTa와 달리 U자 형태를 대체적으로 그리진 않으나 중도성향을 기준으로 진보성향이 좀 더 낮은 걸 볼 수 있고 보수성향은 높은 걸 확인할 수 있다.
-
n = 2,659 keyword = ‘Trump’, ‘Biden or Harris’
- 두 키워드를 합쳐보면 전반적으로 Positive 점수는 평탄화되었다.
- Negative 점수는 RoBERTa 처럼 완벽한 U자 형태는 아니지만 어느정도 U자형태를 보이는 것을 알 수 있다.
-
n = 1,920,976 keyword = Random Sample(2007 ~ 2022) 데이터셋 참조
- 일반적으로 크롤링한 데이터들에 대해 언론사의 점수를 확인하기 위해 추가적으로 조사하였다.
- Positive 점수는 평탄화 되어 있으며 Negative 점수는 U자형태를 보이는 것을 알 수 있다.
TextBlob 감성분석
-
TextBlob은 Python 기반의 텍스트 처리 라이브러리로, 자연어 처리(NLP) 작업을 쉽게 수행할 수 있도록 한다.
-
직관적인 API를 제공하며, 감성 분석, 명사 추출, 품사 태깅 등 다양한 텍스트 분석 기능을 지원하며, 여러 언어를 처리할 수 있어 다국어 텍스트 분석에 유용하다.
-
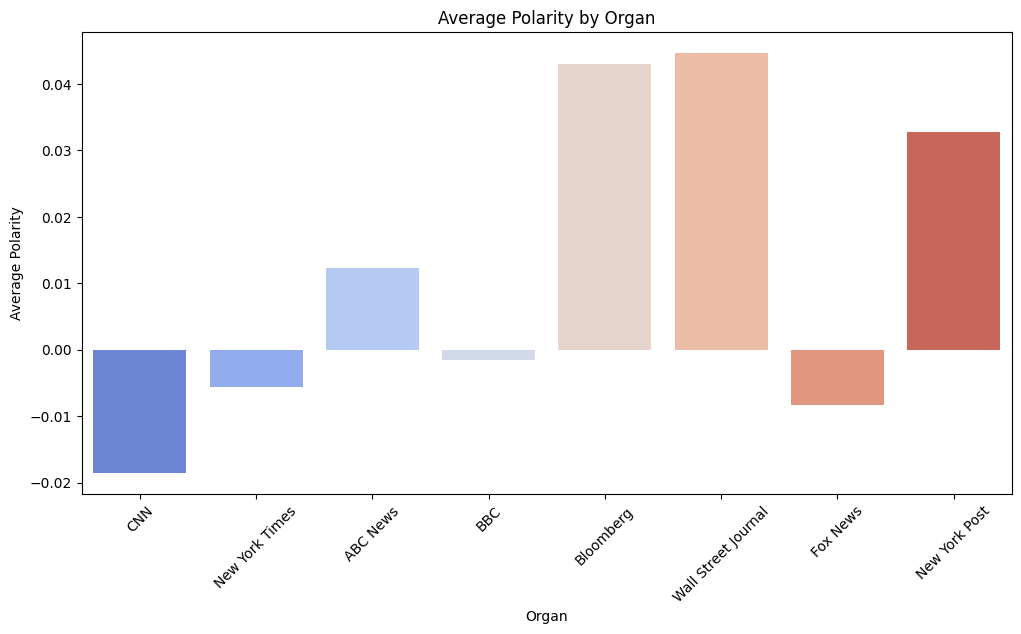
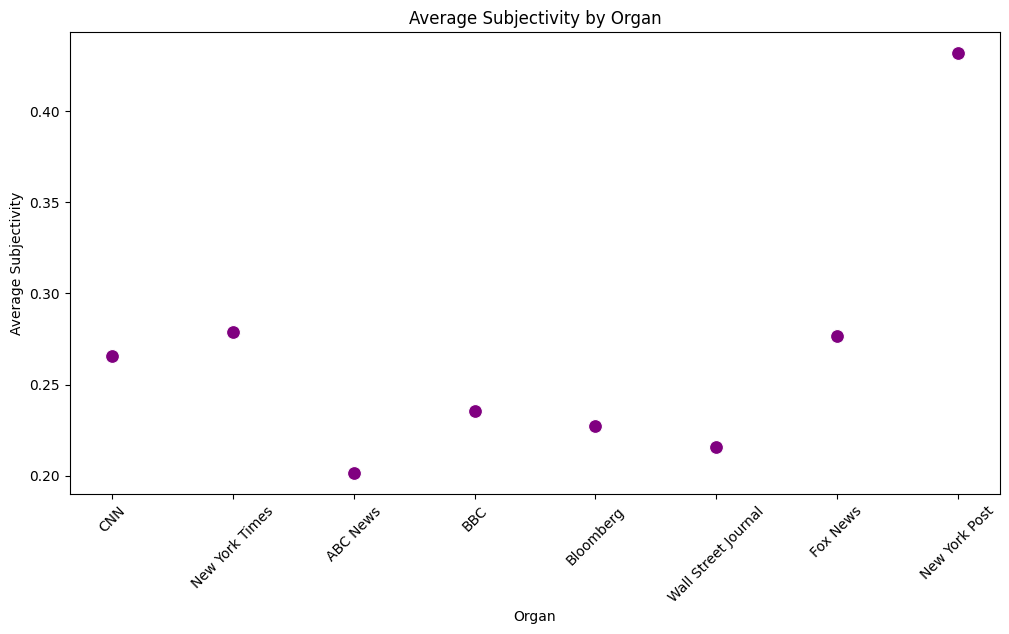
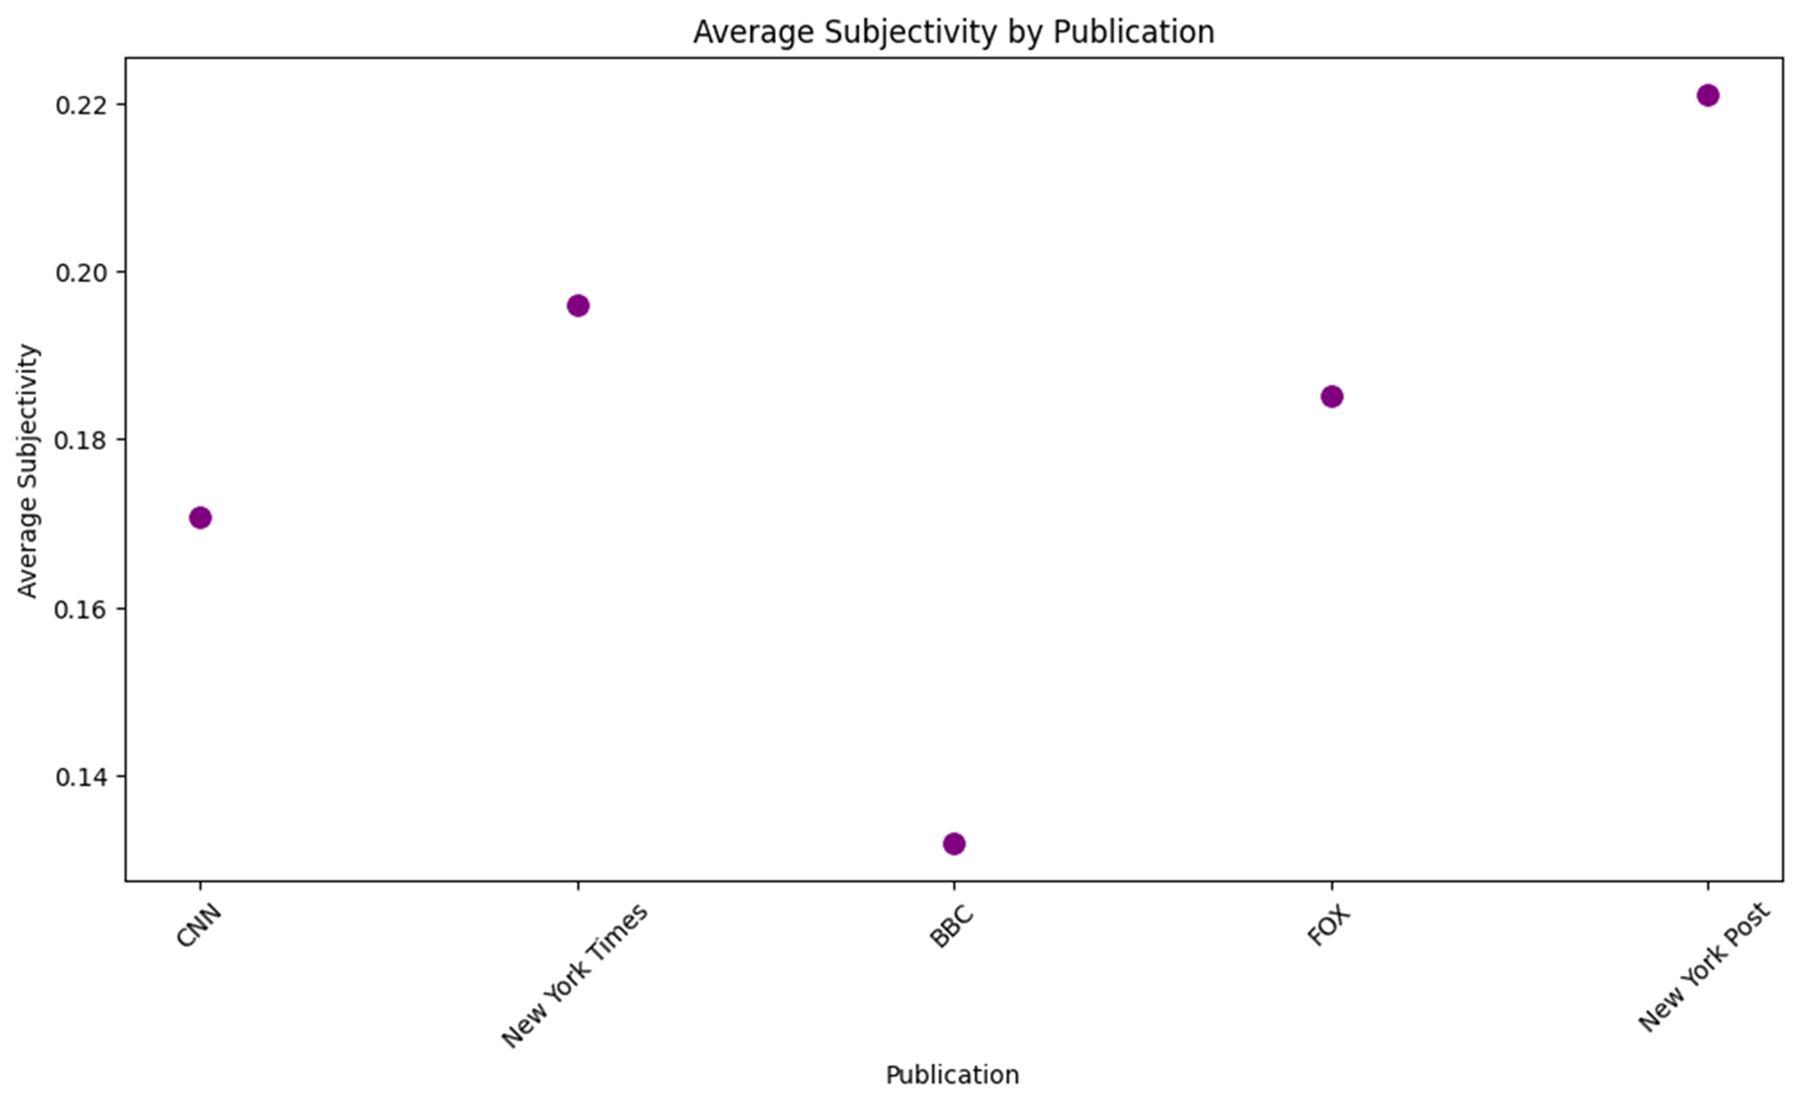
Textblob은 polarity, subjectivity를 측정하는 것이 특징, polarity 는 극성, 즉 얼마나 긍 부정인지 (-1 부정, 1 긍정) subjectivity는 주관성에 해당하며, 0이면 객관적 1이면 주관적이다.
-
Textblob은 subjectivity, 주관성을 확인해보기 위해 확실한 Negative에서 확실한 U자 형태를 띈 ‘Trump’와 전반적인 척도를 확인하기 위해 ‘Random Sample’에서만 실행하였다.
-
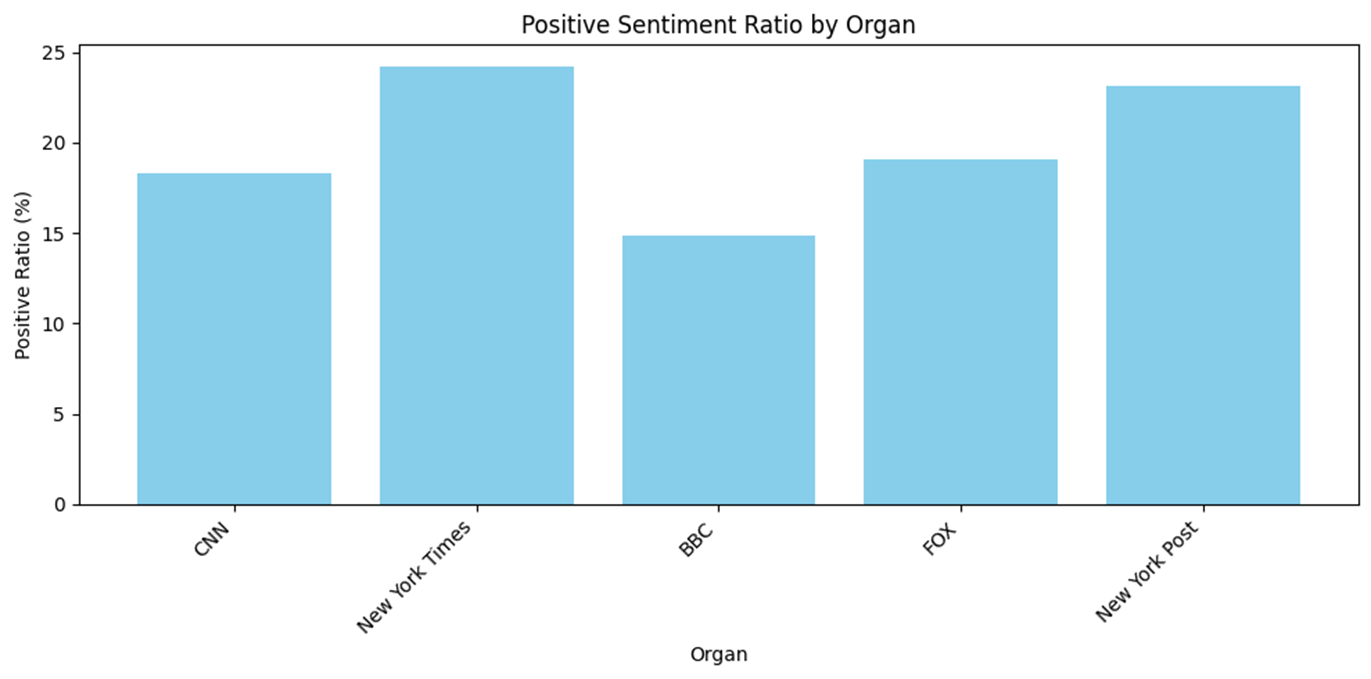
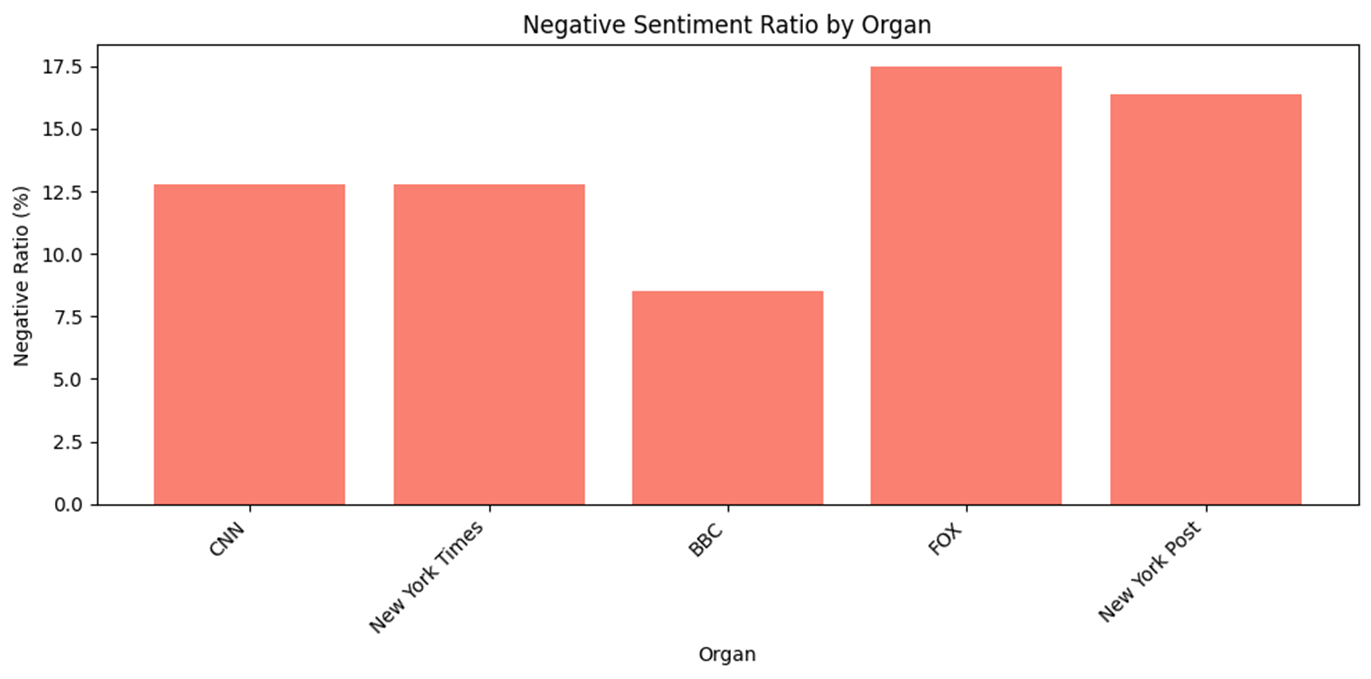
Textblob의 감성분석 과정은 아래와 같이 진행되었다. polarity가 0 보다 크면 positive로 0 보다 작으면 negative로 하였다.
  def get_sentiment(text):
      blob = TextBlob(text)
      polarity = blob.sentiment.polarity
      subjectivity = blob.sentiment.subjectivity
      sentiment_type = 'positive' if polarity > 0 else 'negative' if polarity < 0 else 'neutral'
      return pd.Series([sentiment_type, polarity, subjectivity])

  df[['sentiment', 'polarity', 'subjectivity']] = df['title'].apply(get_sentiment)
organ_summary = df.groupby('Organ', sort = False).agg( avg_polarity=('polarity', 'mean'), avg_subjectivity=('subjectivity', 'mean') ).reset_index() organ_summaryIndex Organ avg_polarity avg_subjectivity 0 CNN -0.018567 0.265412 1 New York Times -0.005672 0.279005 2 ABC News 0.012312 0.201406 3 BBC -0.001557 0.235488 4 Bloomberg 0.043042 0.227498 5 Wall Street Journal 0.044645 0.215768 6 Fox News -0.008266 0.276791 7 New York Post 0.032728 0.431699 -
시각화는 아래와 같이 진행되었다.
newspapers = df['Organ'].unique() sentiment_counts = {newspaper: {'negative': 0, 'neutral': 0, 'positive': 0} for newspaper in newspapers} for index, row in df.iterrows(): newspaper = row['Organ'] sentiment = row['sentiment'] if pd.notna(sentiment): sentiment_counts[newspaper][sentiment] += 1 sentiment_df = pd.DataFrame(sentiment_counts).T sentiment_df = sentiment_df[['negative', 'neutral', 'positive']] sentiment_ratio_df = sentiment_df.div(sentiment_df.sum(axis=1), axis=0) media_outlets = list(sentiment_counts.keys()) positive_ratios = [] negative_ratios = [] for outlet, counts in sentiment_counts.items(): total = counts['negative'] + counts['neutral'] + counts['positive'] positive_ratios.append(counts['positive'] / total * 100) negative_ratios.append(counts['negative'] / total * 100) plt.figure(figsize=(10, 5)) plt.bar(media_outlets, positive_ratios, color='skyblue') plt.xlabel('Organ') plt.ylabel('Positive Ratio (%)') plt.title('Positive Sentiment Ratio by Organ') plt.xticks(rotation=45, ha='right') plt.tight_layout() plt.show() plt.figure(figsize=(10, 5)) plt.bar(media_outlets, negative_ratios, color='salmon') plt.xlabel('Organ') plt.ylabel('Negative Ratio (%)') plt.title('Negative Sentiment Ratio by Organ') plt.xticks(rotation=45, ha='right') plt.tight_layout() plt.show()plt.figure(figsize=(12, 6)) sns.barplot(x='Organ', y='avg_polarity', data=organ_summary, palette="coolwarm") plt.title("Average Polarity by Organ") plt.xlabel("Organ") plt.ylabel("Average Polarity") plt.xticks(rotation=45) plt.show()plt.figure(figsize=(12, 6)) sns.scatterplot(x='Organ', y='avg_subjectivity', data=organ_summary, color="purple", s=100) plt.title("Average Subjectivity by Organ") plt.xlabel("Organ") plt.ylabel("Average Subjectivity") plt.xticks(rotation=45) plt.show()
TextBlob 감성분석 결과
-
n = 1,734 keyword = ‘Trump’
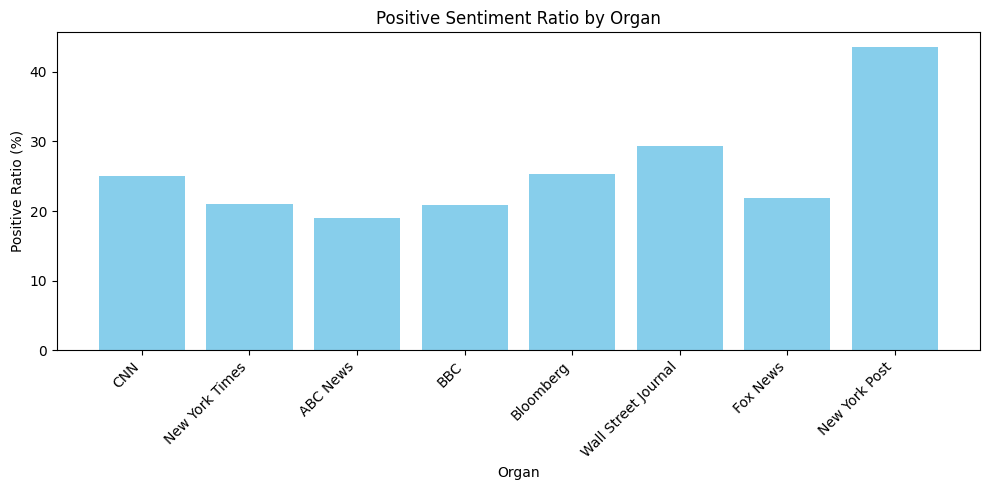
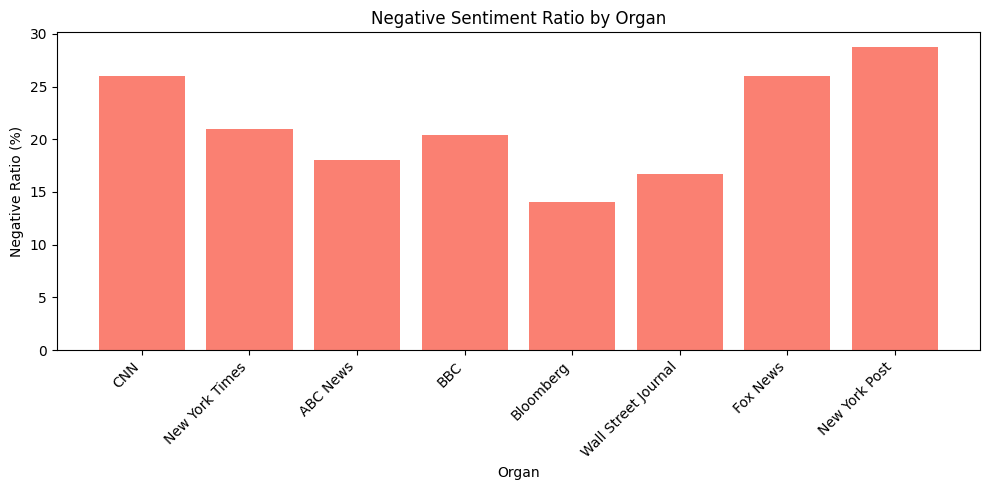
- TextBlob으로도 RoBERTa, VADER와 비슷한 양상을 보인다. 이는 점수의 평균이 아니라 개수의 비율을 수치화한 것이기 때문에 같은 양상이라고 볼 수 만은 없을 것이다.
-
Polarity의 점수 평균을 보면 진보성향일수록 Polarity가 낮은걸 볼 수 있고 보수성향일수록 높은걸 볼 수 있다. 즉, 진보는 ‘Trump’에 부정적, 보수는 ‘Trump’에 긍정적이라고 평가한다.
-
Subjectivity를 살펴보면 중도성향일수록 Subjectivity 점수가 낮고 양극단으로 갈수록 Subjectivity 점수가 높다. 즉, 중도성향일수록 객관적이며 중도에서 멀어질수록 주관적이라는 것이 나타나며 U자 형태를 보인다.
-
n = 1,920,976 keyword = Random Sample(2007 ~ 2022) 데이터셋 참조
- 거대 표본을 조사하였을 때는 긍·부정의 점수가 대체적으로 평탄화되어 있다.
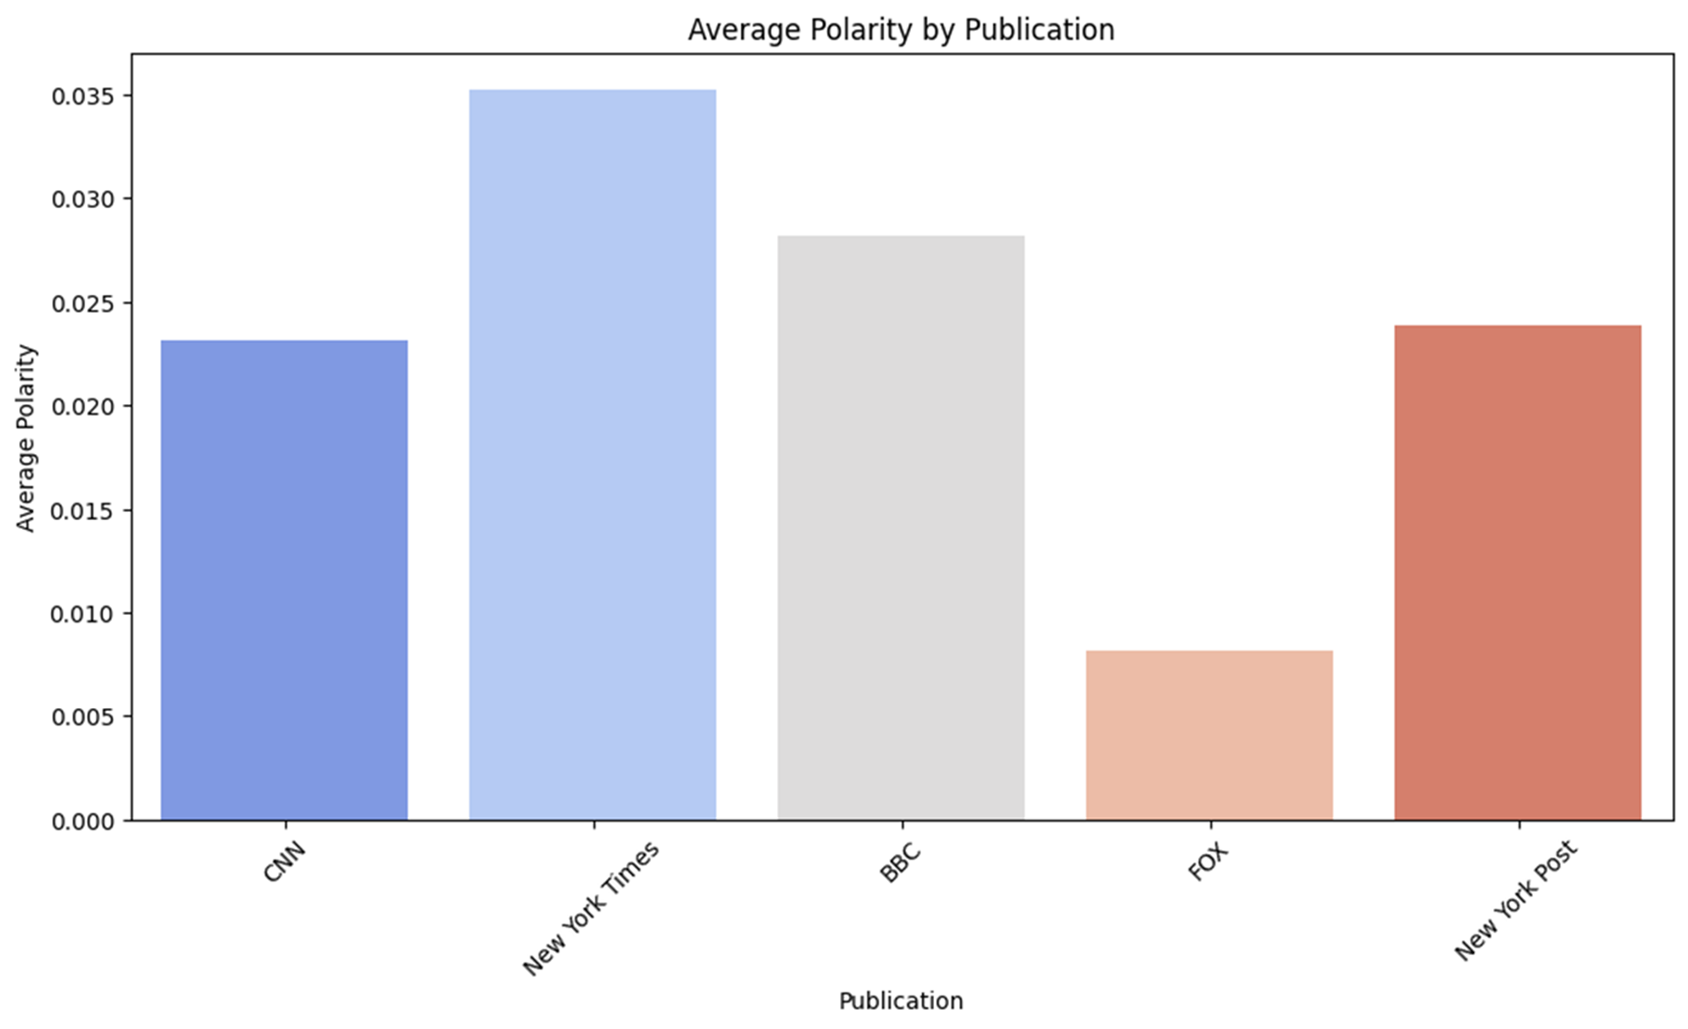
- Polarity의 평균을 보았을 때는 점수가 2% 내외로 중립에 가깝다.
- 하지만 Subjectivity 점수를 보면 중도에 가까울수록 객관적이고 중도에서 멀어질수록 주관적이라는 것이 나타난다.
LDATopic
-
LDATopic 모델링이란 문서에서 잠재적인 주제를 발견하기 위한 비지도 학습기법이다. 문서 집합을 입력으로 받아 각 문서와 단어에 주제를 할당한다. 반복적인 추정을 통해 주제와 단어 간의 관계를 최적화한다.
-
결과적으로 대량의 데이터에서 유용한 주제를 자동으로 추출할 수 있다.
-
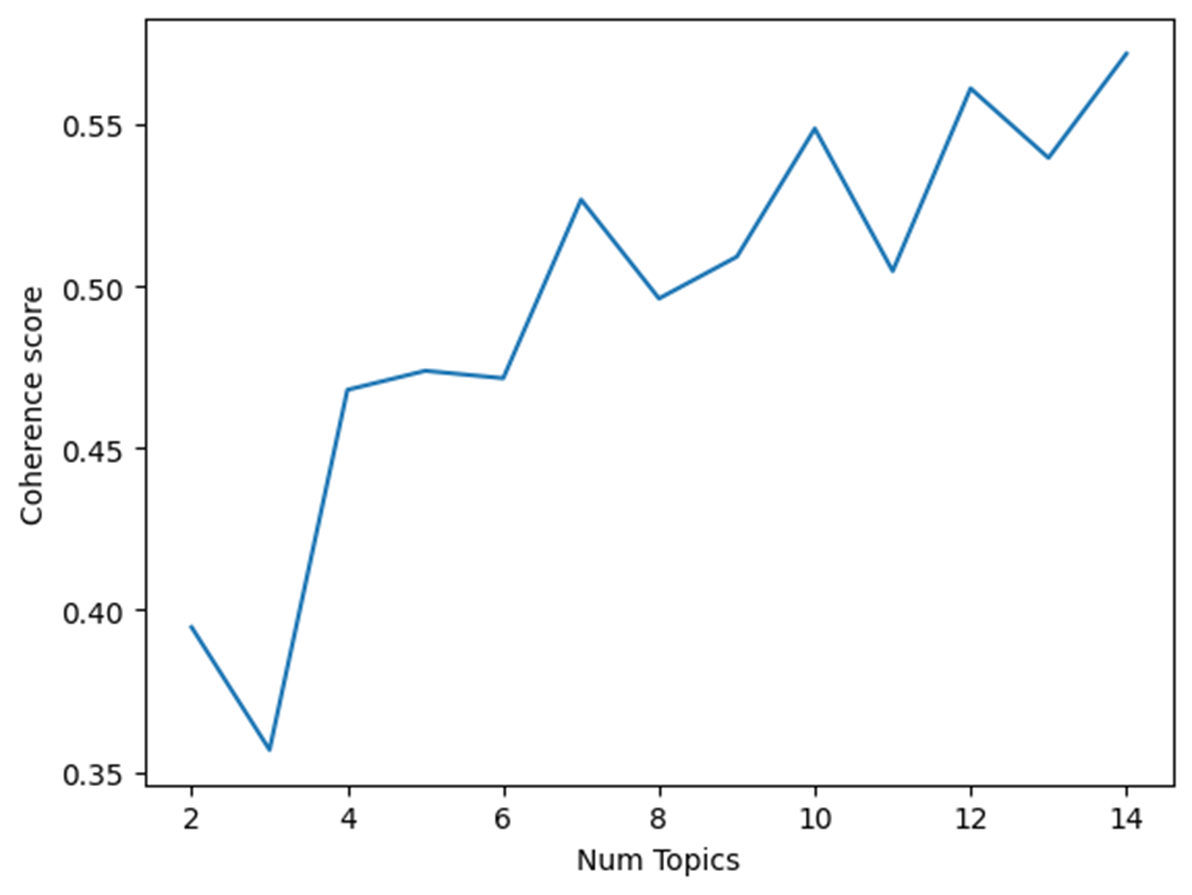
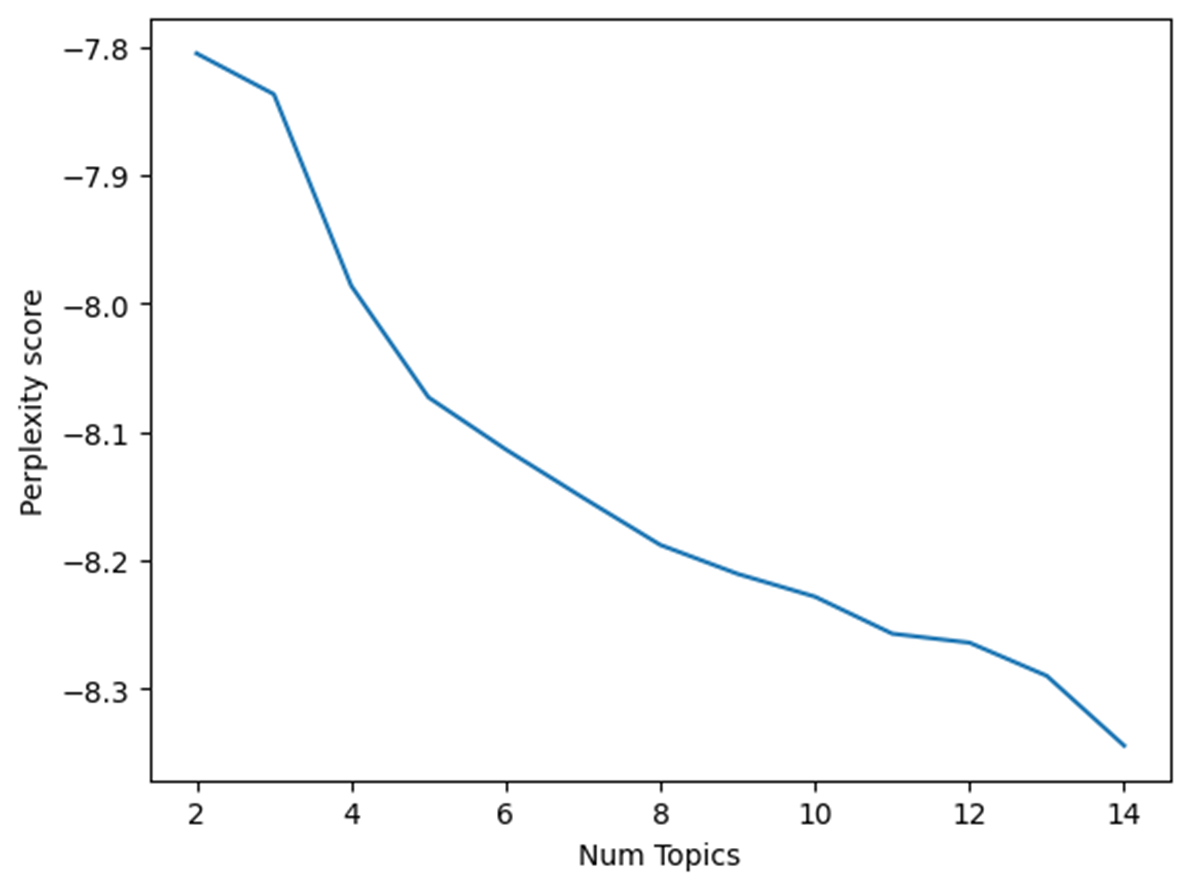
LDATopic에는 Coherence와 Perplexity 점수가 존재한다. Coherence가 높을수록 적합한 토픽의 개수라고 할 수 있고 Perplexity는 낮을수록 설명성이 좋다.
-
LDATopic은 ‘Trump’, ‘Biden or Harris’에서 모델링을 해보았으며 LDATopic을 통해서 각 토픽별 감성분석 결과가 어떤지 확인하였다.
-
LDATopic 과정은 아래와 같다.
nlp = spacy.load('en_core_web_lg') spacy_stopwords = list(nlp.Defaults.stop_words) nlp.max_length = 40000000 -
Harris, Biden, Trump는 불용어로 제거하였으며 ‘(apostrophe)를 데이터 전처리할 때, 삭제하여 ‘s’혼자 남겨진 것도 불용어로 제거하였다.
  def tokenize(text):
  custom_stopwords = ['Harris', 'Biden', 'Trump', 'Donald', 'trump','s']
  words = []
  doc = nlp(text)
  for token in doc:
      if token.text not in spacy_stopwords and token.text not in custom_stopwords:
      words.append(token.text)
  return words
processed_data = [tokenize(title) for title in sdf.title] output_file = "tokenized_data_example" with open(output_file, 'w', encoding='utf-8') as f: for data in tqdm(processed_data): f.write(",".join(data) + "\n")processed_data = [sent.strip().split(",") for sent in tqdm(open("tokenized_data_example", 'r', encoding='utf-8').readlines())] processed_data = DataFrame(processed_data) processed_data2 = [] for i in processed_data: i = list(filter(None, i)) processed_data2.append(i) processed_data = processed_data2import gensim from gensim.models import CoherenceModel from gensim.models.ldamodel import LdaModel from gensim.models.callbacks import CoherenceMetric from gensim import corpora from gensim.models.callbacks import PerplexityMetric import logging logging.basicConfig(format='%(asctime)s : %(levelname)s : %(message)s', level=logging.INFO) dictionary = corpora.Dictionary(processed_data) dictionary.filter_extremes(no_below=2, no_above=0.5) corpus = [dictionary.doc2bow(text) for text in processed_data] -
Perplextivy value
perplexity_values = [] for i in range(2,15): ldamodel = gensim.models.ldamodel.LdaModel(corpus, num_topics=i, id2word = dictionary, passes=15) perplexity_values.append(ldamodel.log_perplexity(corpus)) x=range(2,15) plt.plot(x,perplexity_values) plt.xlabel("Num Topics") plt.ylabel("Perplexity score") plt.show() -
Coherence value
coherence_values = [] for i in range(2,15): ldamodel = gensim.models.ldamodel.LdaModel(corpus, num_topics=i, id2word = dictionary, passes=15) coherence_model_lda = CoherenceModel(model=ldamodel, texts=processed_data, dictionary=dictionary, coherence='c_v') coherence_values.append(coherence_model_lda.get_coherence()) x = range(2,15) plt.plot(x,coherence_values) plt.xlabel("Num Topics") plt.ylabel("Coherence score") plt.show() -
Topic Modeling
num_topics = 7 chunksize = 2000 passes = 20 iterations = 400 eval_every = None temp = dictionary[0] id2word = dictionary.id2token model = LdaModel( corpus=corpus, id2word=id2word, chunksize=chunksize, alpha='auto', eta='auto', iterations=iterations, num_topics=num_topics, passes=passes, eval_every=eval_every, random_state = 23441 ) top_topics = model.top_topics(corpus) avg_topic_coherence = sum([t[1] for t in top_topics]) / num_topics print('Average topic coherence: %.4f.' % avg_topic_coherence) from pprint import pprint pprint(top_topics) -
LDATopic 시각화 저장
  import pickle
  import pyLDAvis.gensim_models as gensimvis
  import pyLDAvis
  from gensim.models.coherencemodel import CoherenceModel
  import matplotlib.pyplot as plt

  lda_visualization = gensimvis.prepare(model, corpus, dictionary, sort_topics=False)
  pyLDAvis.save_html(lda_visualization, '파일 이름.html')
LDATopic 모델링 결과
-
Coherence & Perplextity
-
Topic의 개수가 7개일 때, Coherence의 점수가 첨점으로 최적의 점수가 도출되는 것을 확인할 수 있으며 그 이상의 Topic은 Coherence의 점수가 크게 변하지 않는다.
-
Perplexity의 경우 Topic의 개수가 늘어날수록 점수가 낮아지므로 가장 최적인 7개의 토픽으로 설정했다.
-
-
모델링 결과물
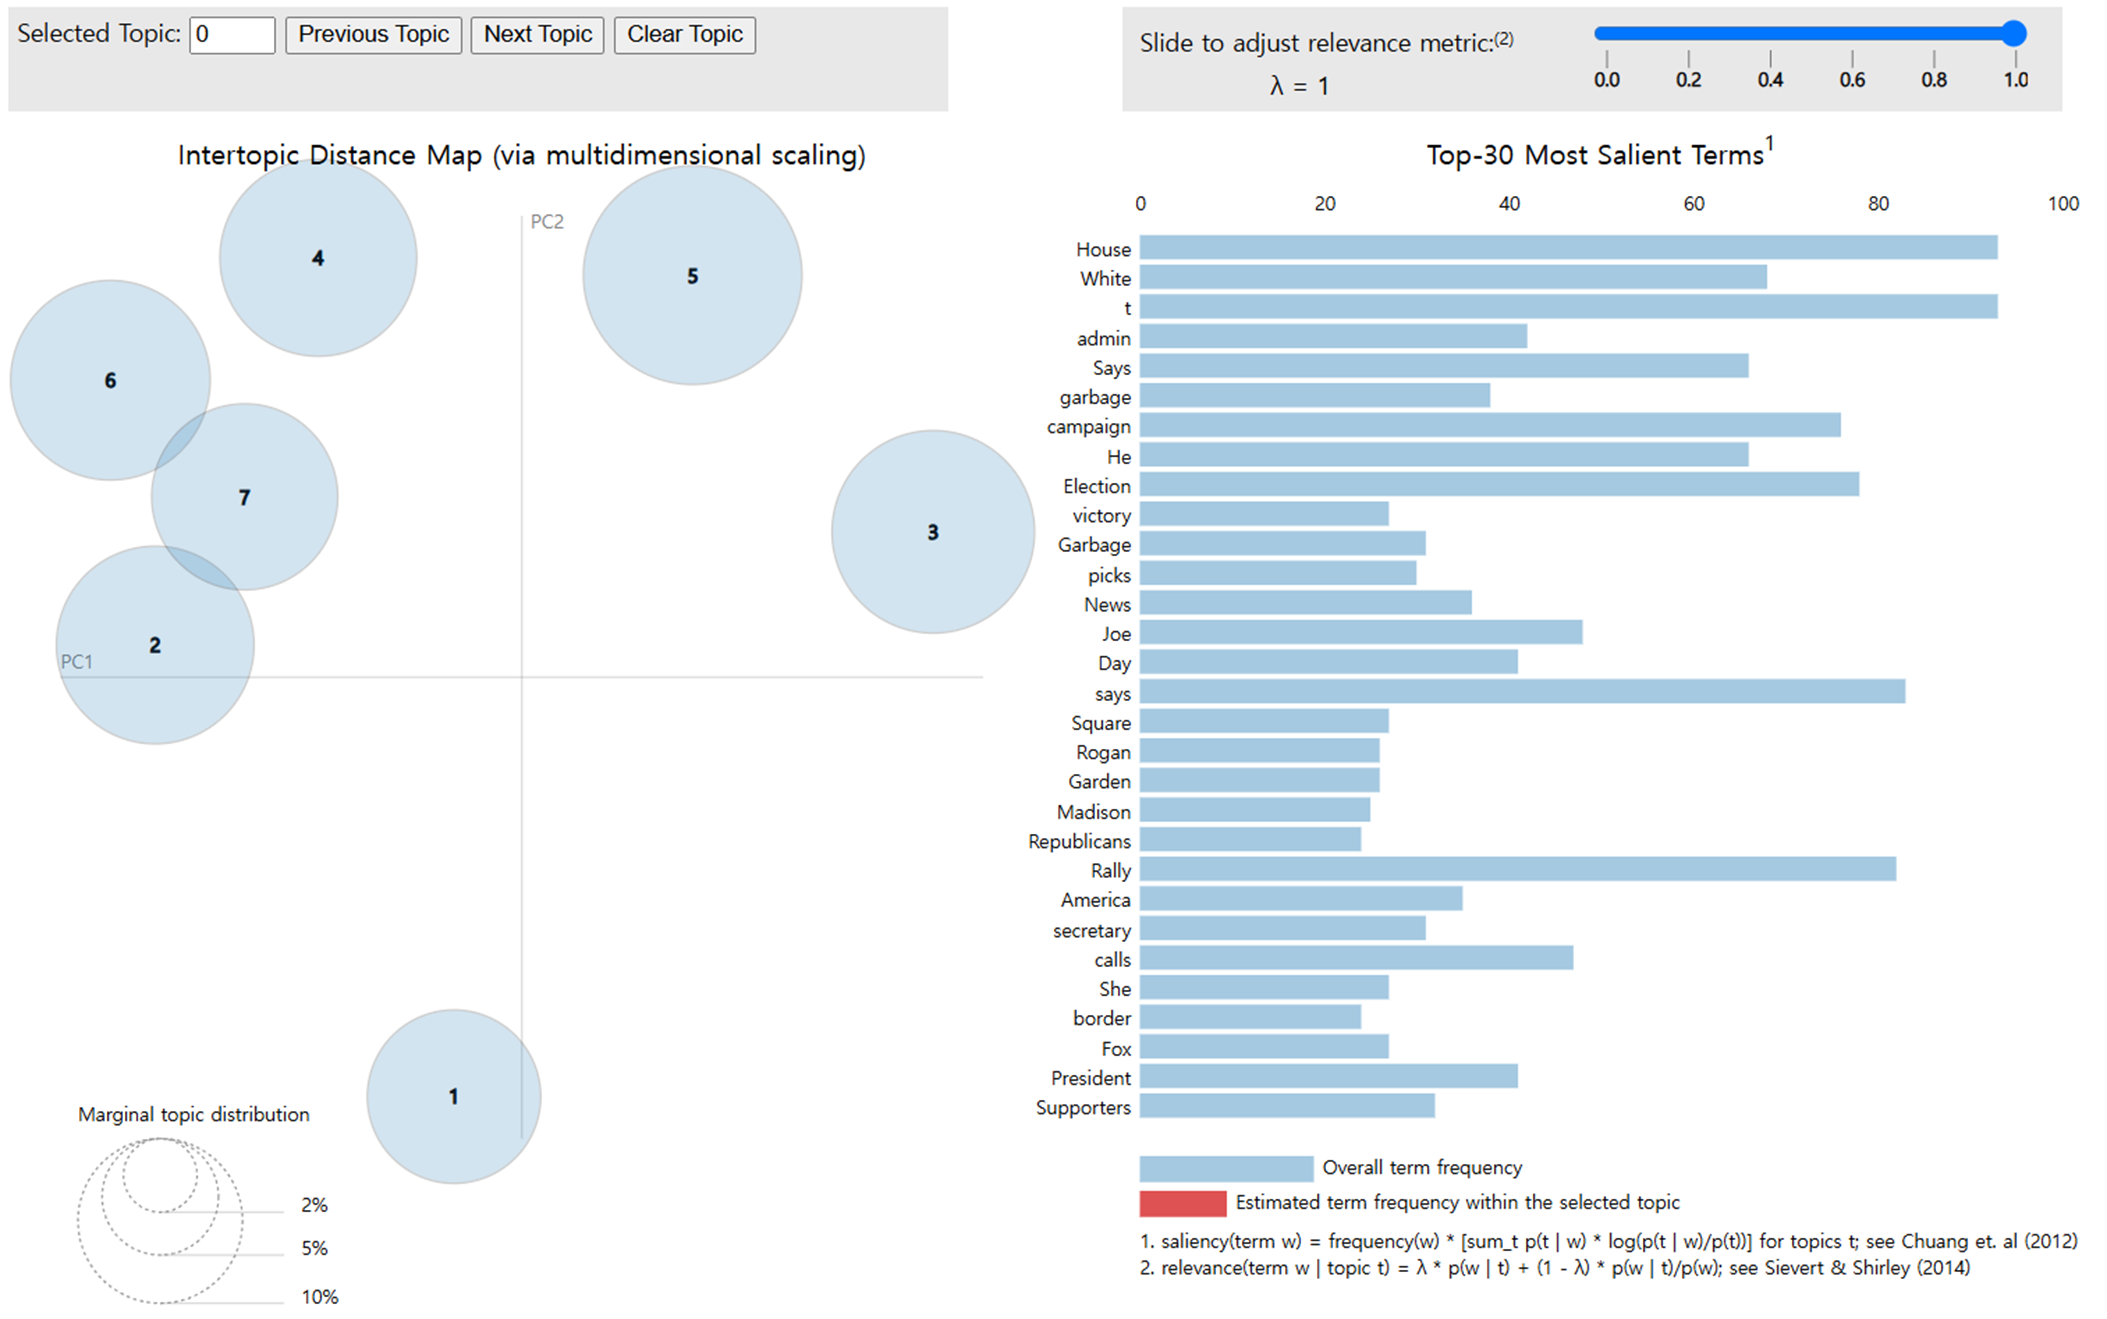
-
Topic #1 : Running Mate
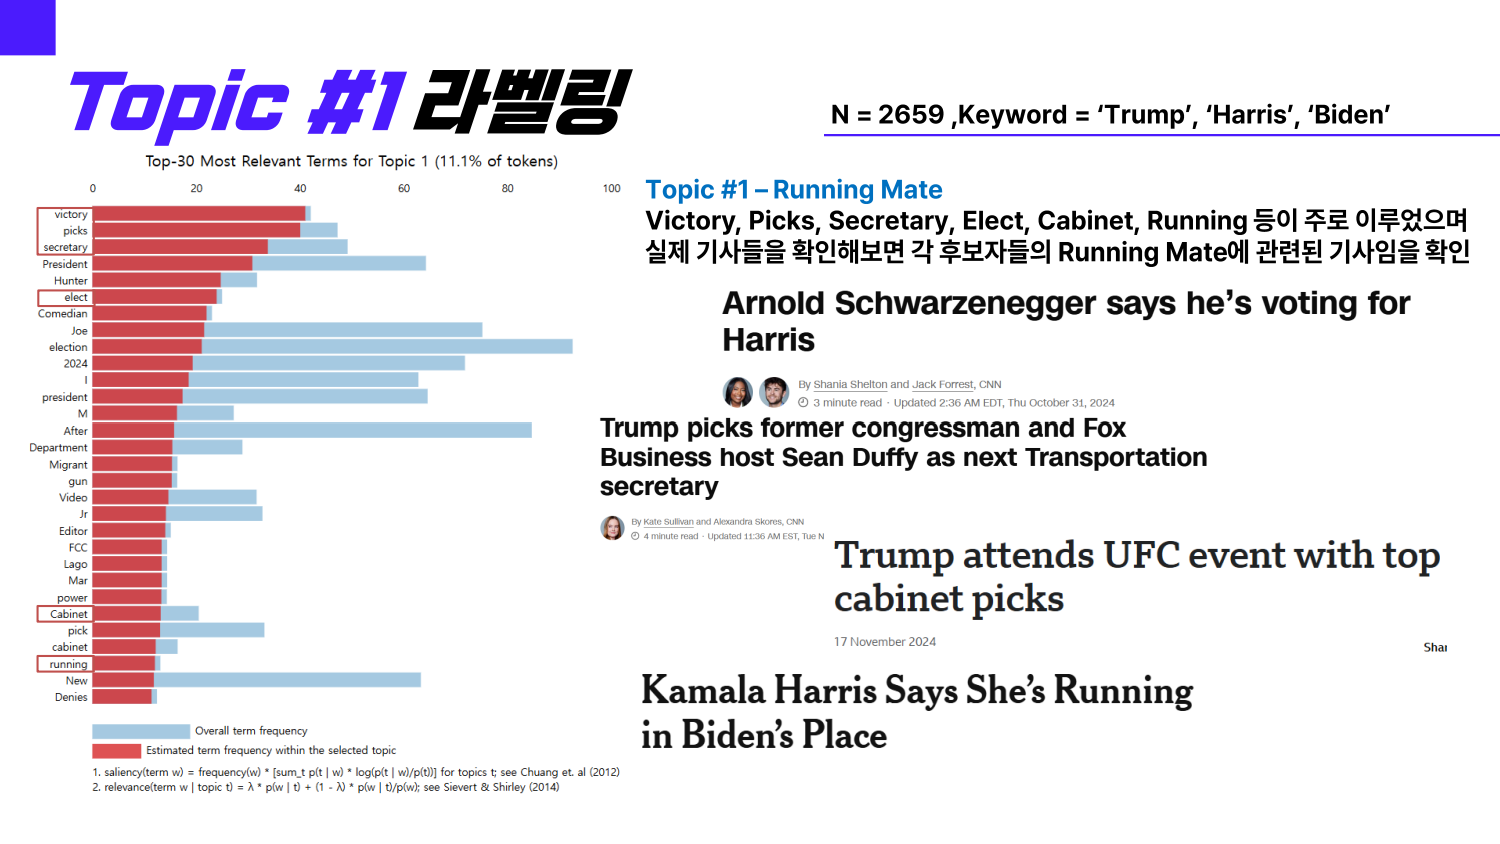
-
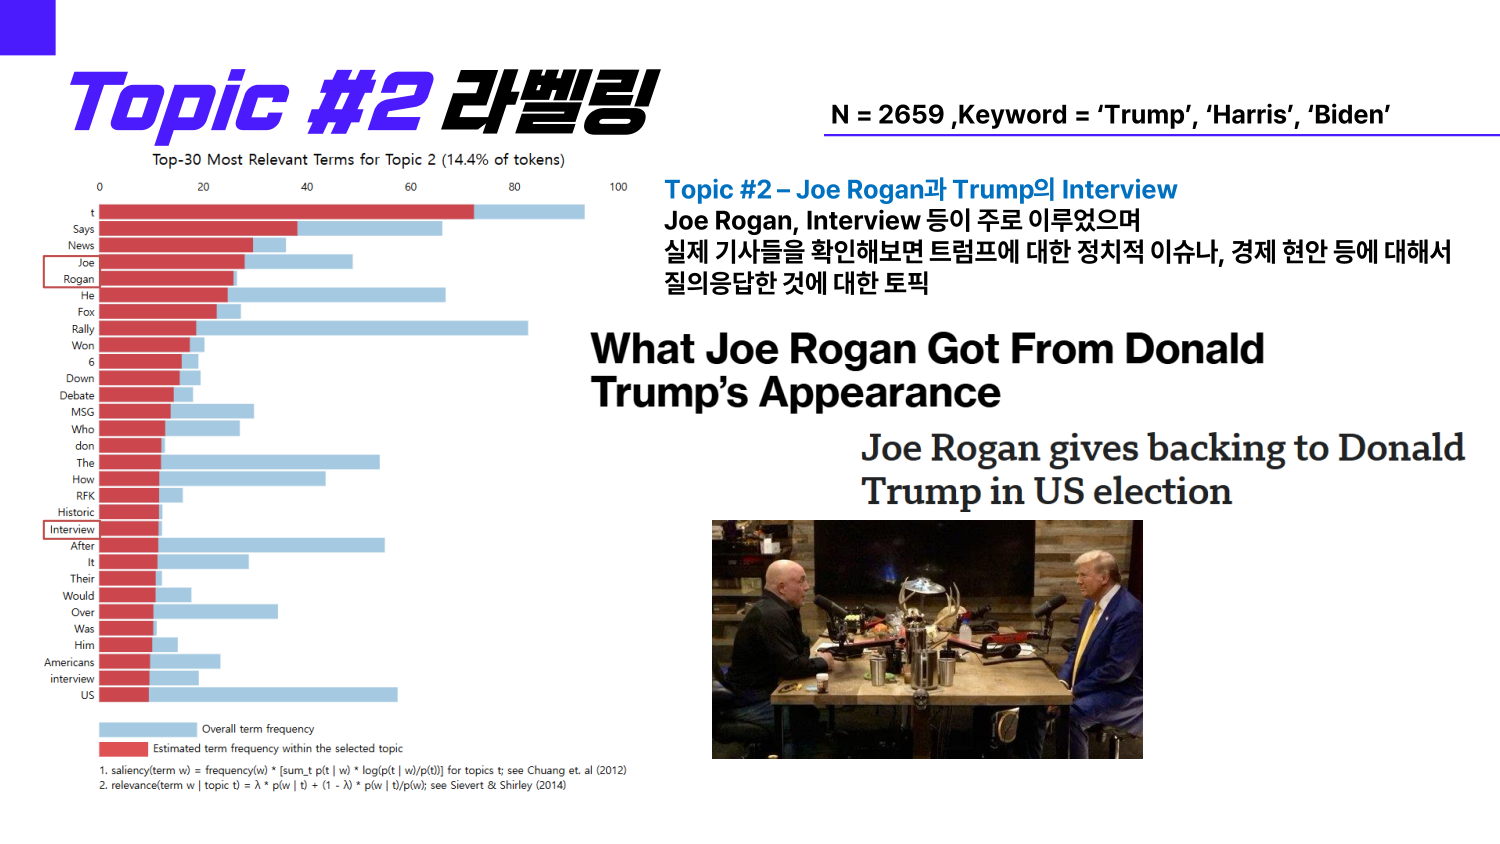
Topic #2 : Joe Rogan과 Trump의 Interview
-
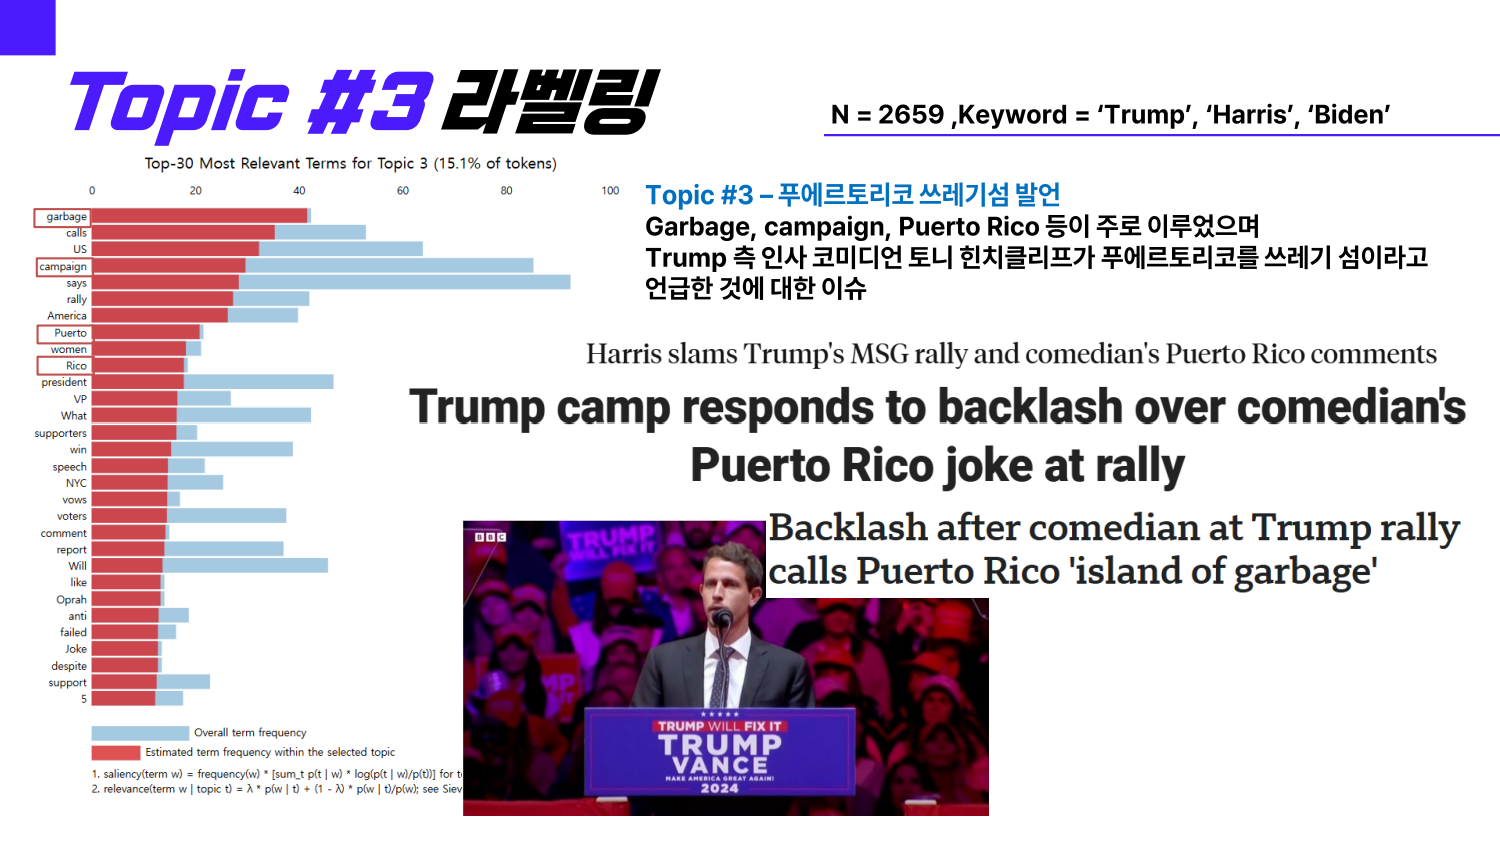
Topic #3 : 푸에르토리코 쓰레기섬 발언
-
Topic #4 : 바이든의 ‘트럼프 지지자들은 쓰레기’ 발언
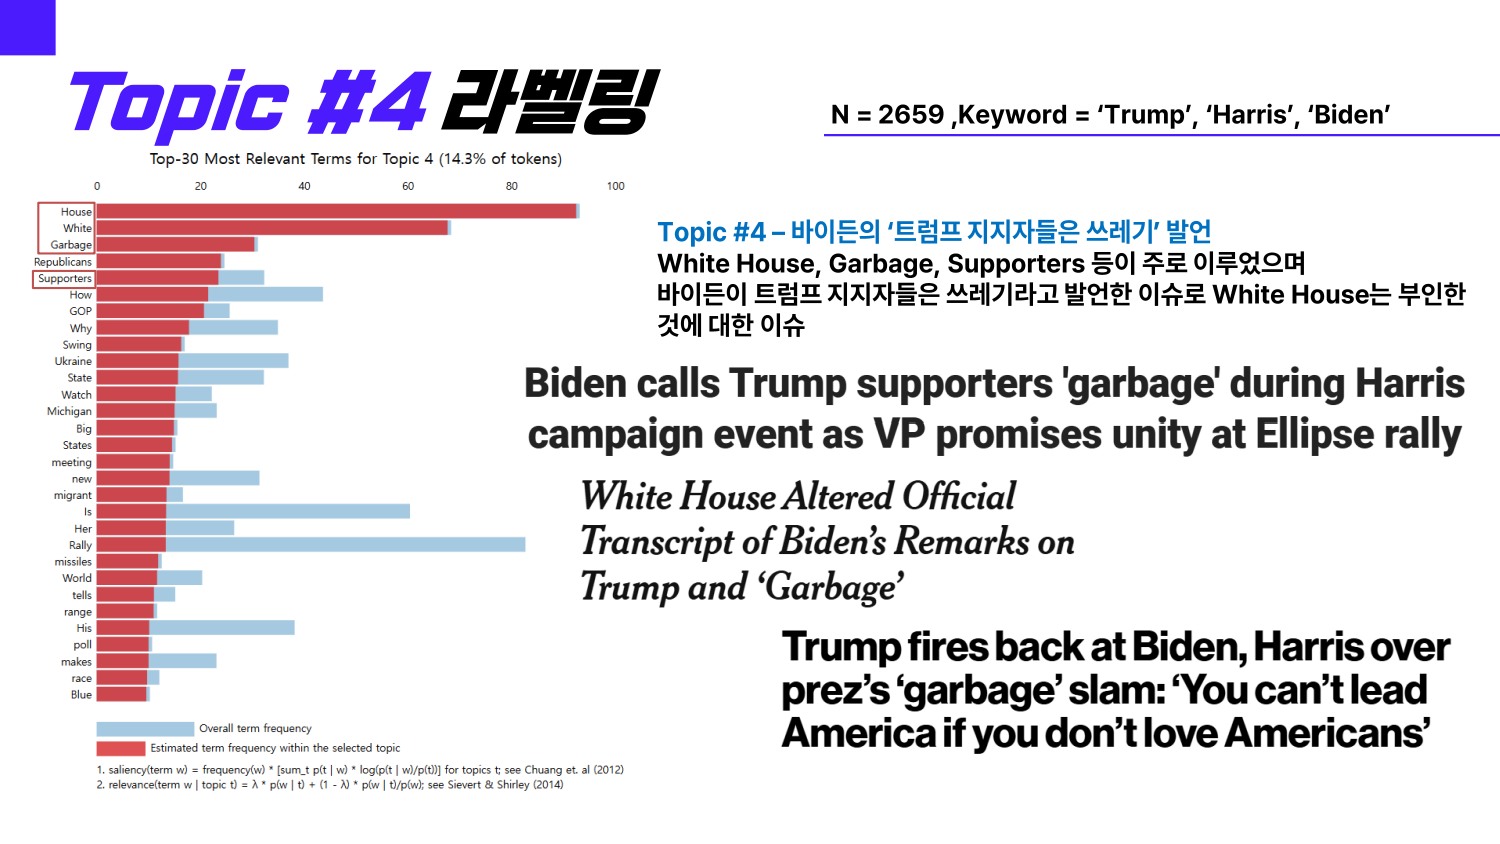
-
Topic #5 : 트럼프와 일론 머스크 펜실베니아 선거 유세
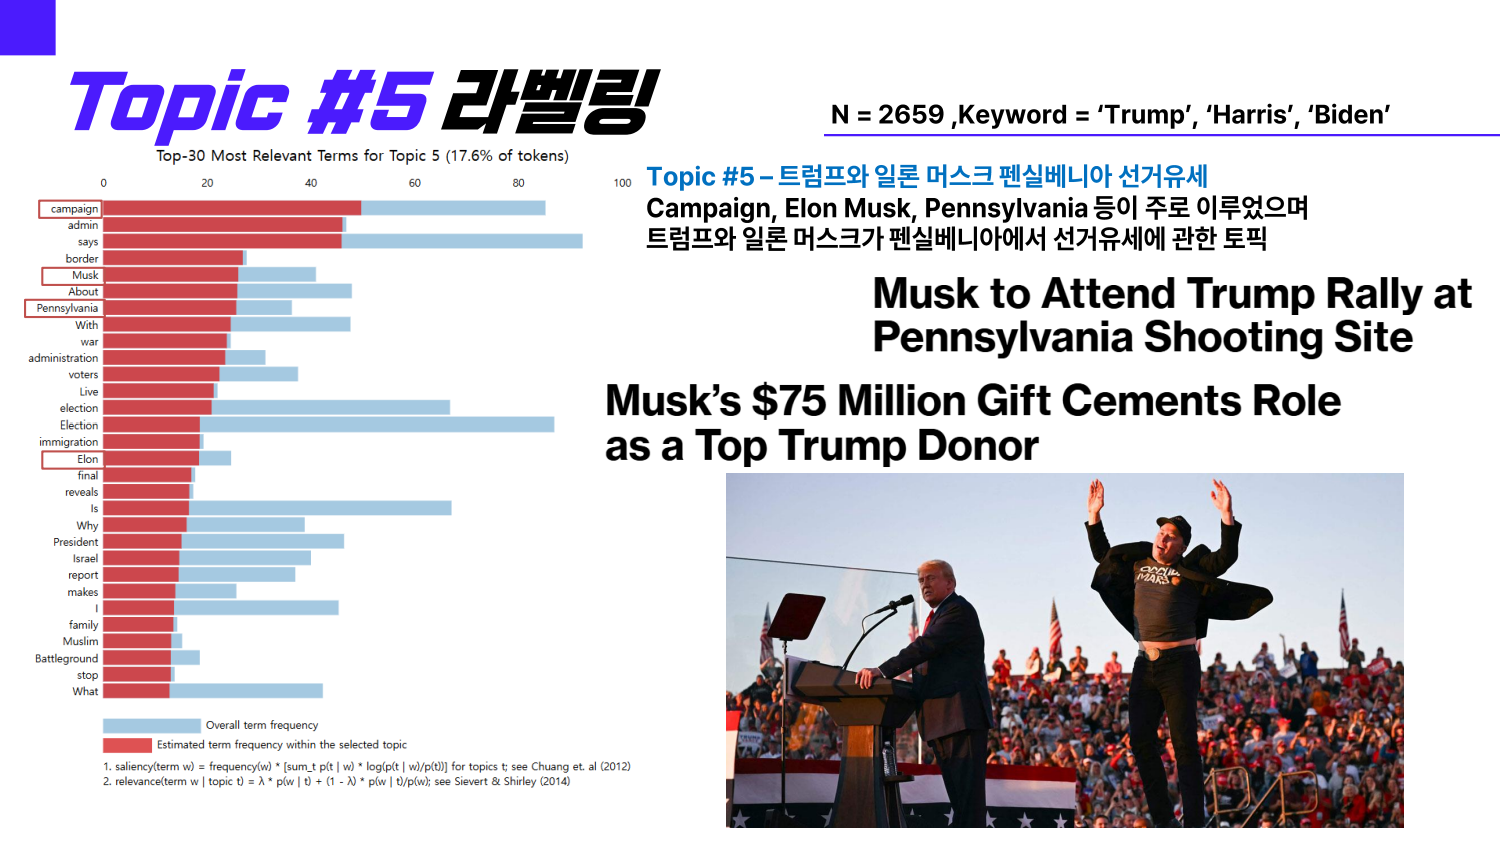
-
Topic #6 : Madison Square Garden에서의 Trump 유세
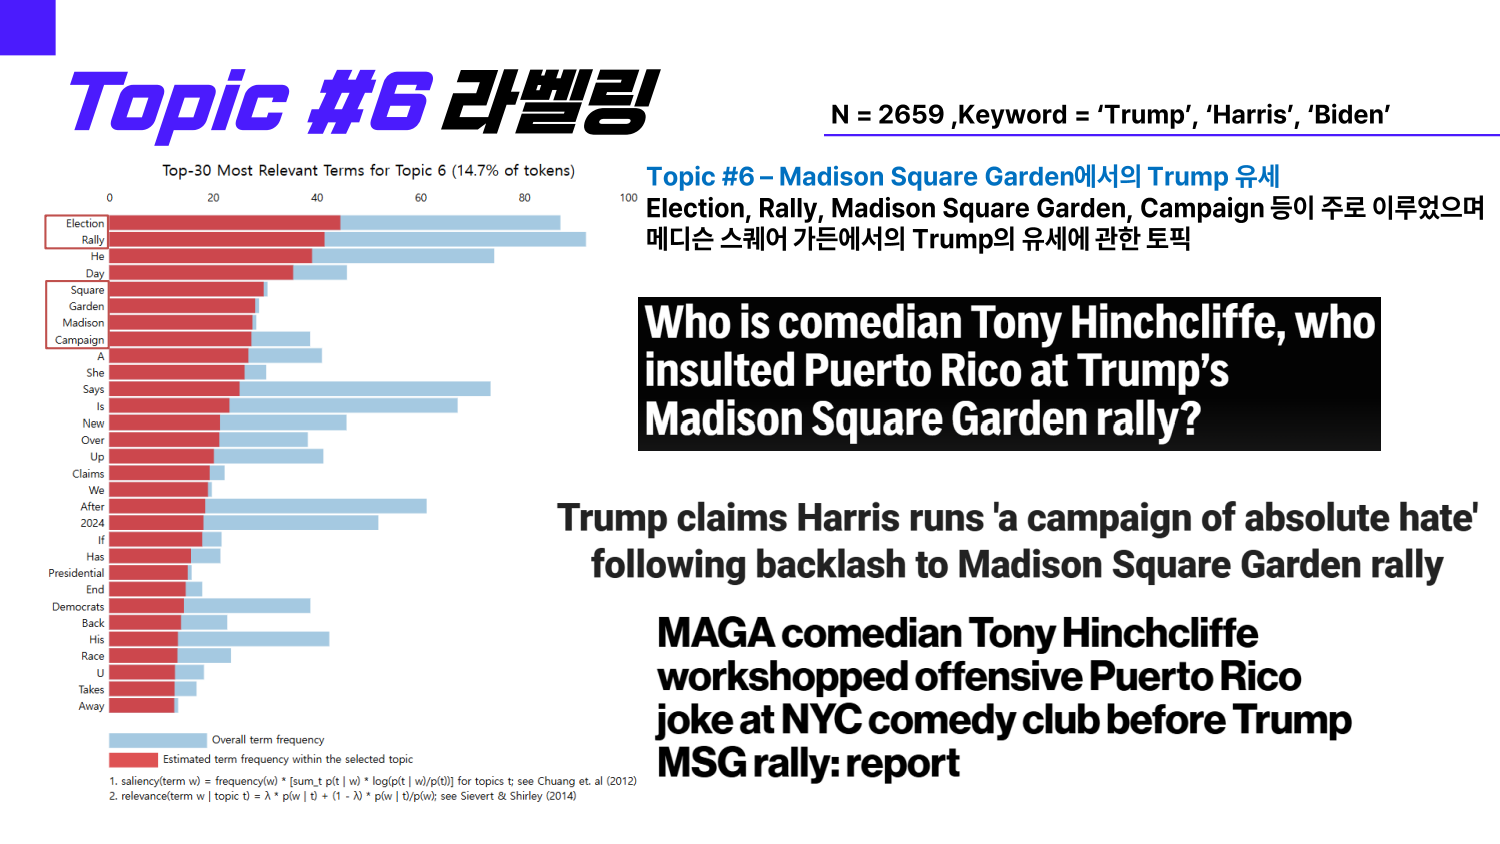
-
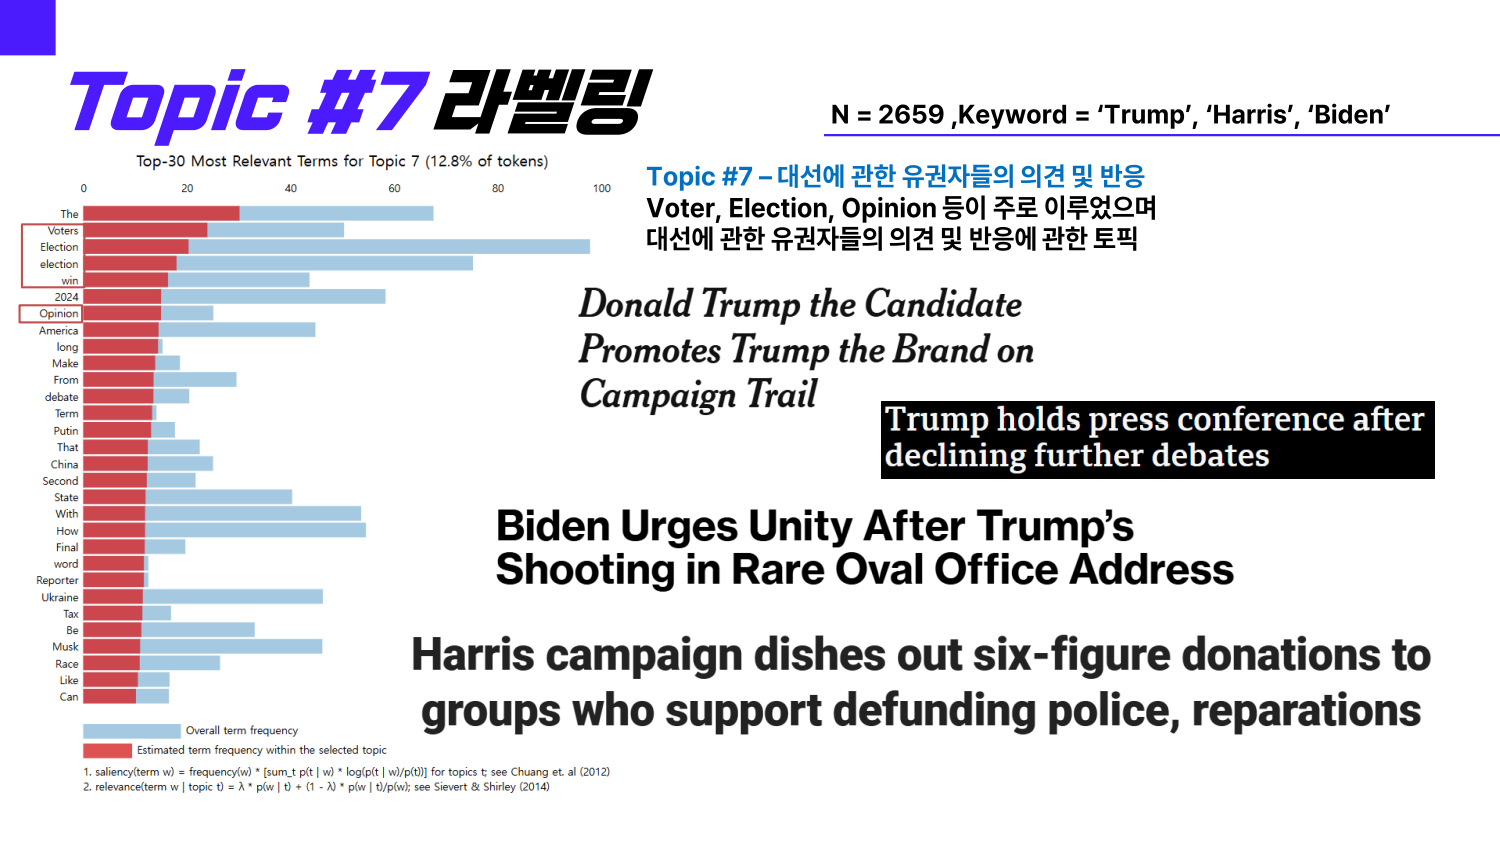
Topic #7 : 대선에 관한 유권자들의 의견 및 반응
종합분석
-
Topic별 RoBERTa 감성분석 결과
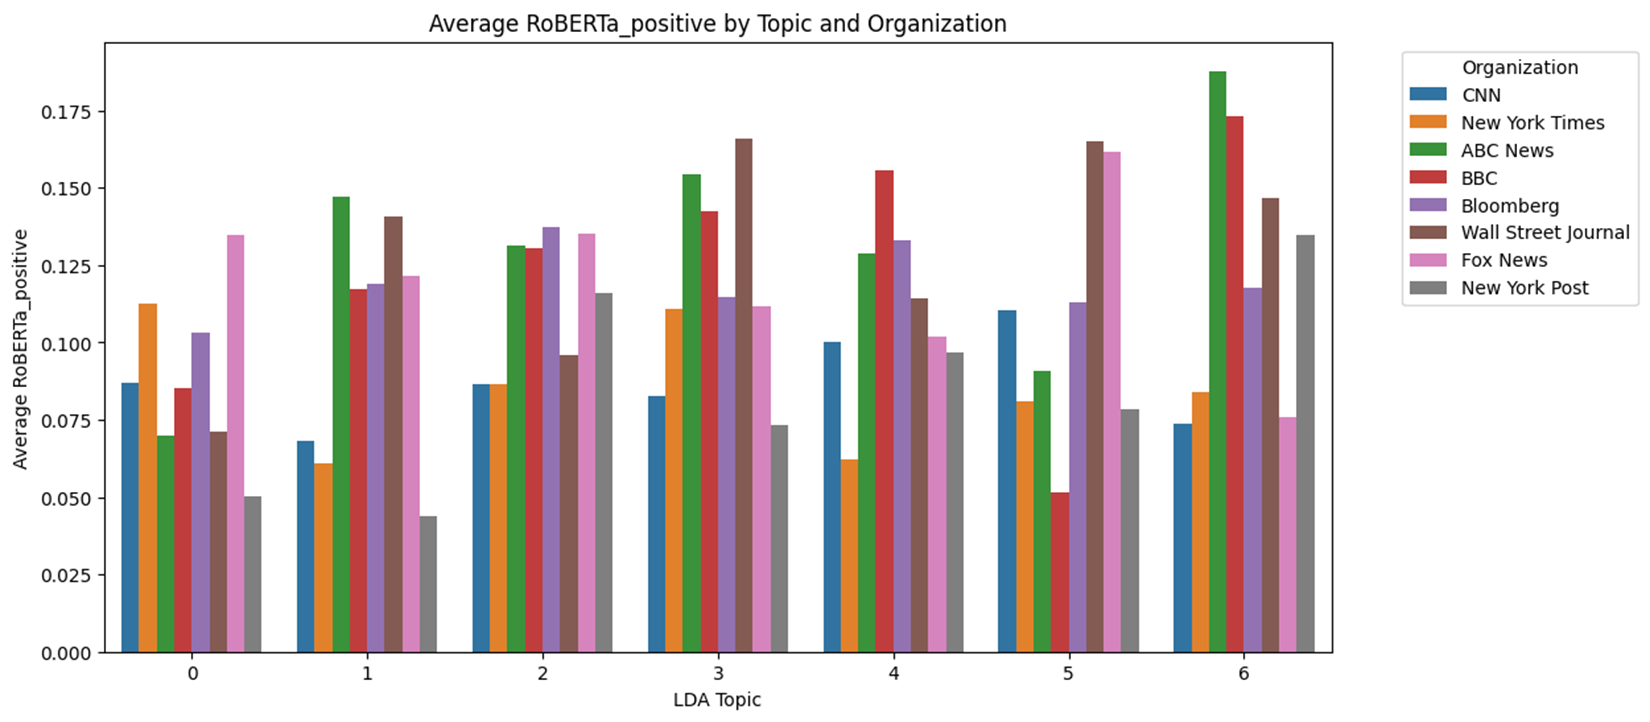
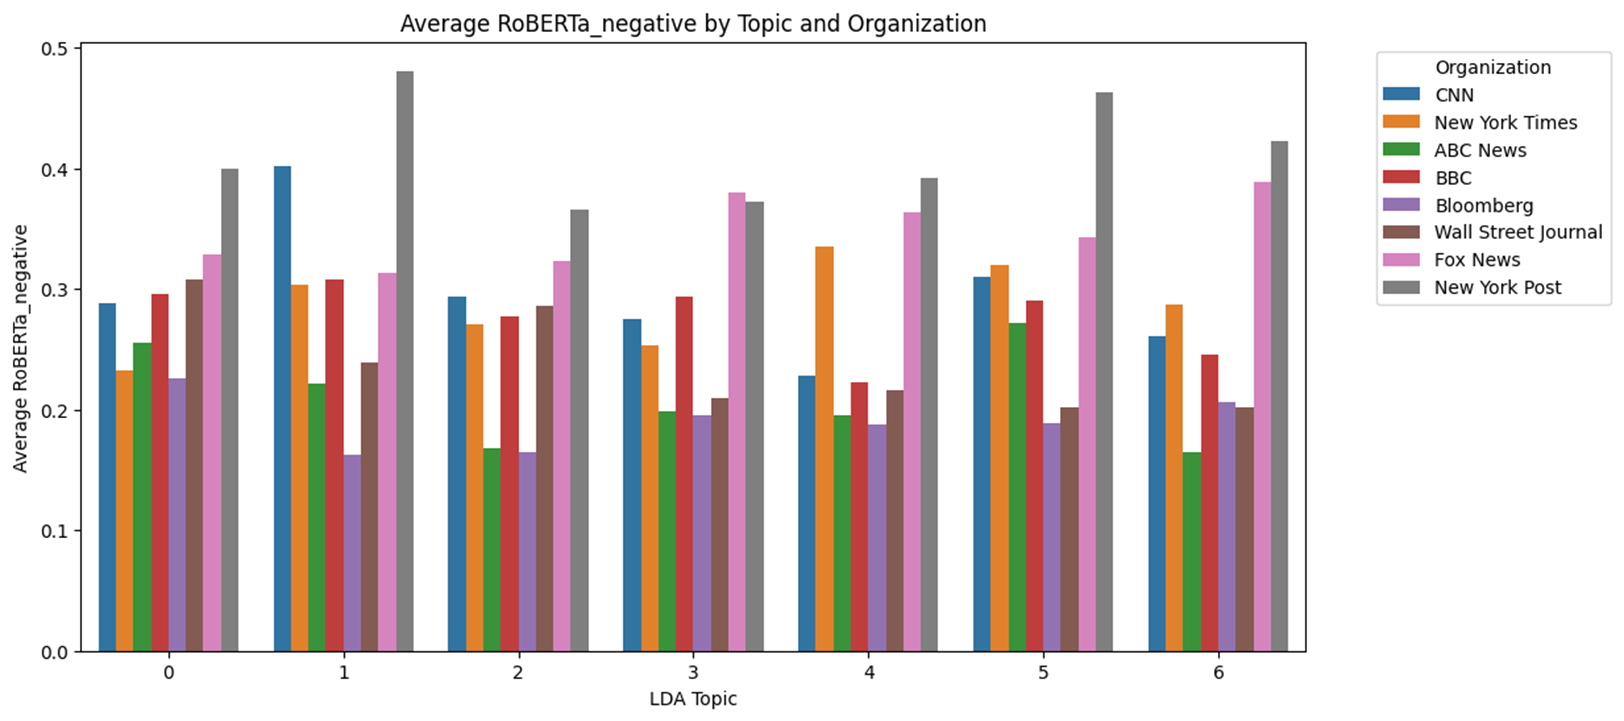
- Topic 별로 보았을 때, Negative 점수는 대체로 앞서 분석한 것과 같이 U자 형태를 많이 띈다. 즉, 어떤 Topic이더라도 중도매체에 비해 전보성향이나 보수성향이 강할수록 Negative 점수가 높게 나타났는데 이는 일반적인 Topic보다는 정치적 Topic에서 좀 더 두드러졌다.
- 예를 들어 Topic #2 ~ Topic #6의 경우 후보자에 관한 이슈이다. 하지만 중도매체는 Negative 점수가 낮은데 비해 진보매체, 보수매체는 Negative가 높게 나타난다. 즉, 정치인 관련 기사는 양극화가 나타나고 있으며 Topic #1과 Topic #7 같이 특정 정치인에 관한 내용이 아닌 것들은 대체적으로 긍부정 점수가 비슷하게 나왔다.
-
Topic별 VADER 감성분석 결과
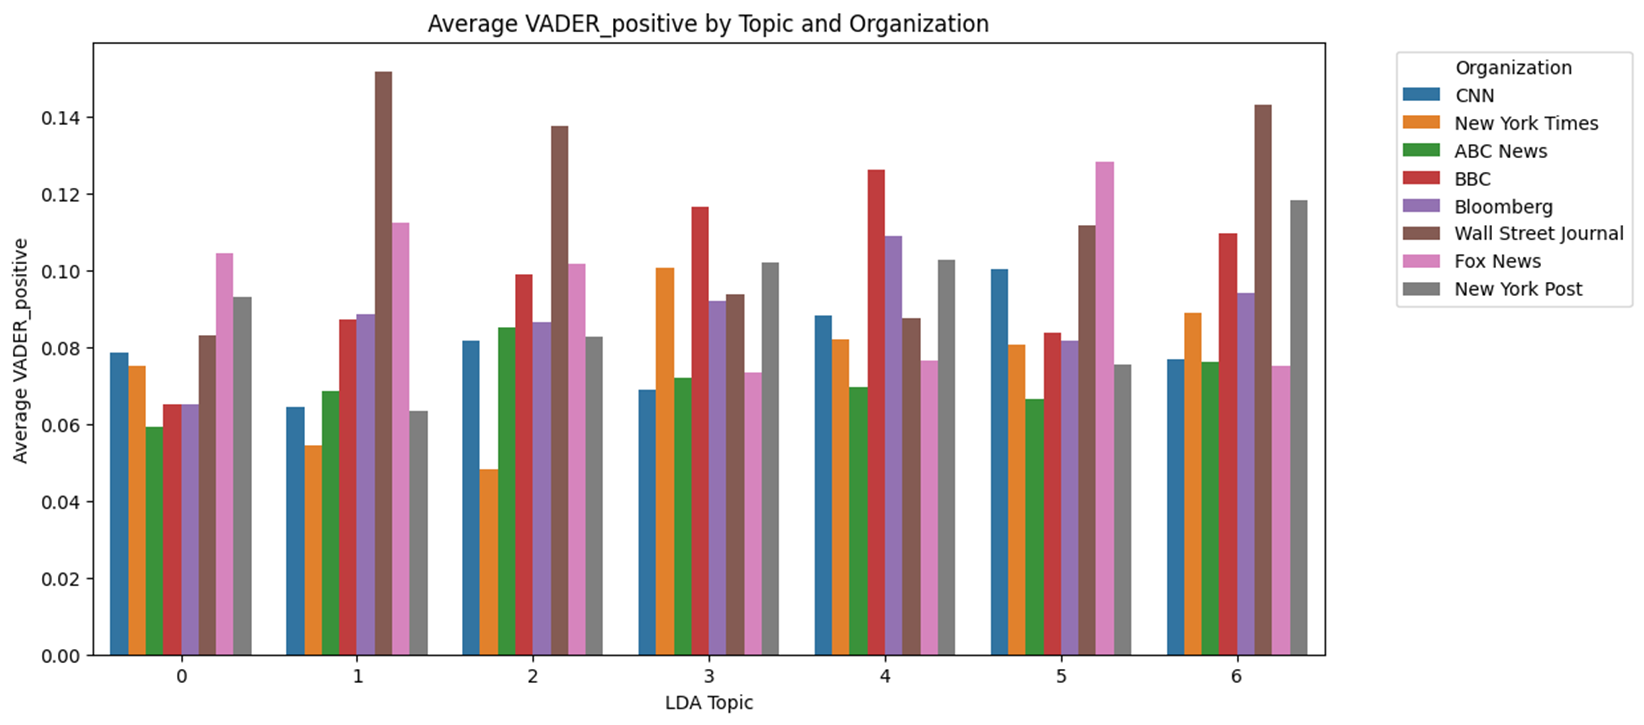
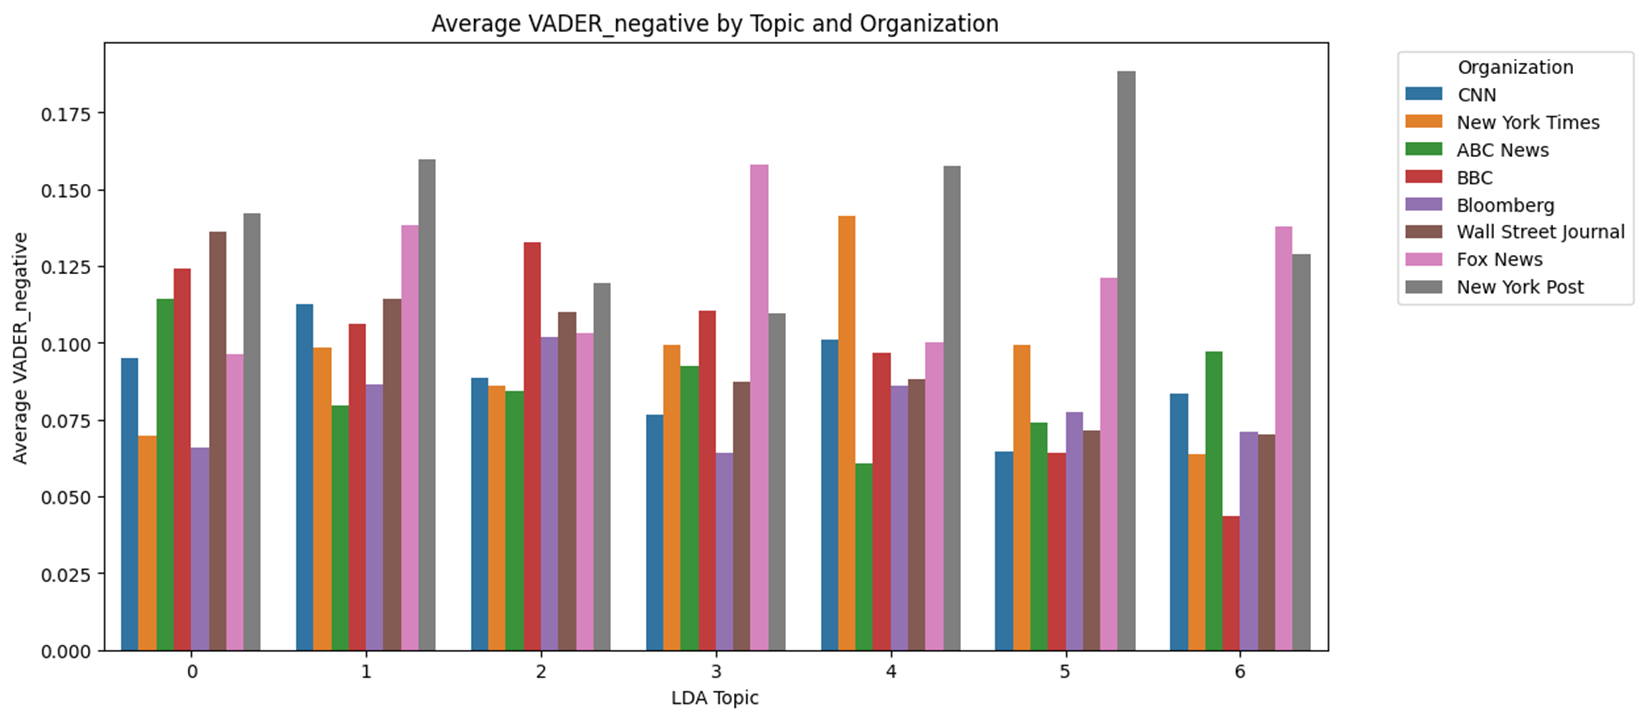
- Topic 별로 살펴보았을 때, 앞선 RoBERTa를 활용한 토픽별 감성분석과 큰 차이는 없다.
- 하지만 Topic #2와 Topic #6 등 Trump 선거 유세에 대해서는 보수매체의 Positive 점수가 유의미하게 높았다.
결론
-
해당 프로젝트에서는 언론사별 Headline을 감성분석하였다. 언론기사 내용이 아니라 Headline만을 분석하더라도 중도에서 멀어질수록 양극화가 있다는 사실을 알 수 있었다. 해당 현상은 특히 Negative점수에서 명확하게 확인할 수 있었으며 Textblob을 이용하여 검증하였을 때, 이는 Subjectivity와 어느정도 연관성이 있음을 보여준다.
-
일반적으로 Trump에 대한 보수 매체의 Positive 점수는 높았으며 Biden과 Harris에 대한 진보 매체의 Positive 점수가 보수 매체에 비해 높은 것을 확인할 수 있었다.
-
따라서 Negative 점수만으로 설명되긴 어렵지만 Positive 점수의 편향과 Negative 점수를 적절히 섞어서 보면 해당 글의 감성이 어떤 편향을 가지고 있는지 충분히 확인할 수 있을 것이다.
-
중도성향에서 멀어질수록 Textblob의 Subjectivity 점수가 높아진다는 점, Negative 점수가 높아진다는 점을 통해 Negative 점수가 높을수록 좀 더 주관적이고 솔직한 감정을 나타내지 않을까 생각한다. 또한 Positive 점수는 각 보수는 ‘Trump’, 진보는 ‘Biden’과 ‘Harris’에서 높은 것을 확인할 수 있으므로 편향은 Positive로 확인할 수 있다. 따라서 양극화 현상은 실제로 존재하고 있으며 해당 현상은 다양한 Topic과 매체의 편향성을 종합적으로 고려해야한다.
파급효과 및 솔루션 이용방향
-
해당 프로젝트를 통해 긍부정의 정도를 시각화하여 대중들이 쉽게 이해할 수 있는 형태로 정보를 제공할 수 있고 분석결과를 통해 독자들이 다양한 관점을 고려할 수 있도록 도와주는 판단지표가 될 수 있다.
-
정성적인 요소를 정량적으로 평가할 수 있다. 언론이 얼마나 편향되어 있는지 정성적인 수치로 어느정도 파악할 수 있다. 이는 언어 전문가의 도움을 받아 충분히 Positive 편항과 Negative 점수를 적절히 조합하여 모델링할 수 있을 것으로 예상된다.
-
편향은 정치에서만 찾아볼 수 있는 것이 아니다. 소비자가 선호하는 제품군에서도 편향은 두드러지고 있다. 예를 들어 삼성 스마트폰 사용자는 삼성 스마트폰만 사용하고 아이폰 사용자는 아이폰만 사용한다. 그 외에도 모니터, PC, 가전제품 등에서도 이러한 편향이 두드러진다. 따라서 대체로 부정적인 리뷰들을 모아서 Topic별로 정리한 뒤 Negative 점수가 얼마나 높은지 조사하면 경쟁사 대비 어떤 Topic에서 Negative점수 즉, 소비자의 불만이 두드러지는지 확인할 수 있을 것이다.
-
예를 들어 스마트폰을 조사한다고 하면 Screen, Battery, Performance, Design 등으로 Topic이 나뉠 것이며 소비자의 주관적인 의견이 담겨있는 Negative 의견들을 모아서 통계를 내보면 대중의 선호도를 파악할 수 있을 것이며 경쟁사 대비 해당 Topic에서 대중의 선호도가 얼마나 떨어지는지 수치적으로 알 수 있을 것이다.
회고
- 실제로 삼성 갤럭시 노트 10리뷰와 아이폰 se2의 리뷰를 FlipKart 후기를 분석을 시행해보았다. 하지만 Positive 점수가 평균 0.9를 넘어 쇼핑몰 후기는 이와 같은 분석이 적잘하지 않다는 것을 알 수 있었다. 대체로 쇼핑몰 후기는 나쁜 후기가 없으며 부정적인 의견들은 커뮤니티나 SNS 댓글들에 몰려있었다. 이러한 의견들을 모아서 분석할 수 있다면 좋은 판단지표로 사용되지 않을까 생각한다.
Reference
-
Pew Research Center, June 2014, Political Polarization in the American Public, Pew Research Center, Retrieved from https://www.pewresearch.org.
-
Dominic Mastrangelo, October 2022, Nearly 60 percent see mainstream media as a threat to democracy: poll, The Hill, Retrieved from https://thehill.com.
-
Megan Brenan, July 2024, U.S. Confidence in Institutions Mostly Flat, but Police Up, Gallup, Retrieved from https://news.gallup.com.
-
Knight Foundation Staff, June 2018, Perceived accuracy and bias in the news media, Knight Foundation, Retrieved from https://knightfoundation.org.
-
D. Rozado, R. Hughes & J. Halberstadt, “Longitudinal analysis of sentiment and emotion in news media headlines using automated labelling with Transformer language models,” PLOS ONE, pp. 1 – 14, October 2022.
-
M. Wankhade, A.C.S. Rao, C. Kulkarni, “A survey on sentiment analysis methods, applications, and challenges,” Artificial Intelligence Review, Vol. 55, pp. 5731 – 5780, February 2022, https://doi.org/10.1007/s10462-022-10144-1.